Metrics
Metrics are one of the main building blocks of Bigeye - they continuously monitor your data and alert you when something looks anomalous.
To get started with metrics, navigate your Catalog tab to the table you are interested in. For this guide, we will use a demo table called AIRFLOW_PAYMENTS_SUBSCRIPTION.
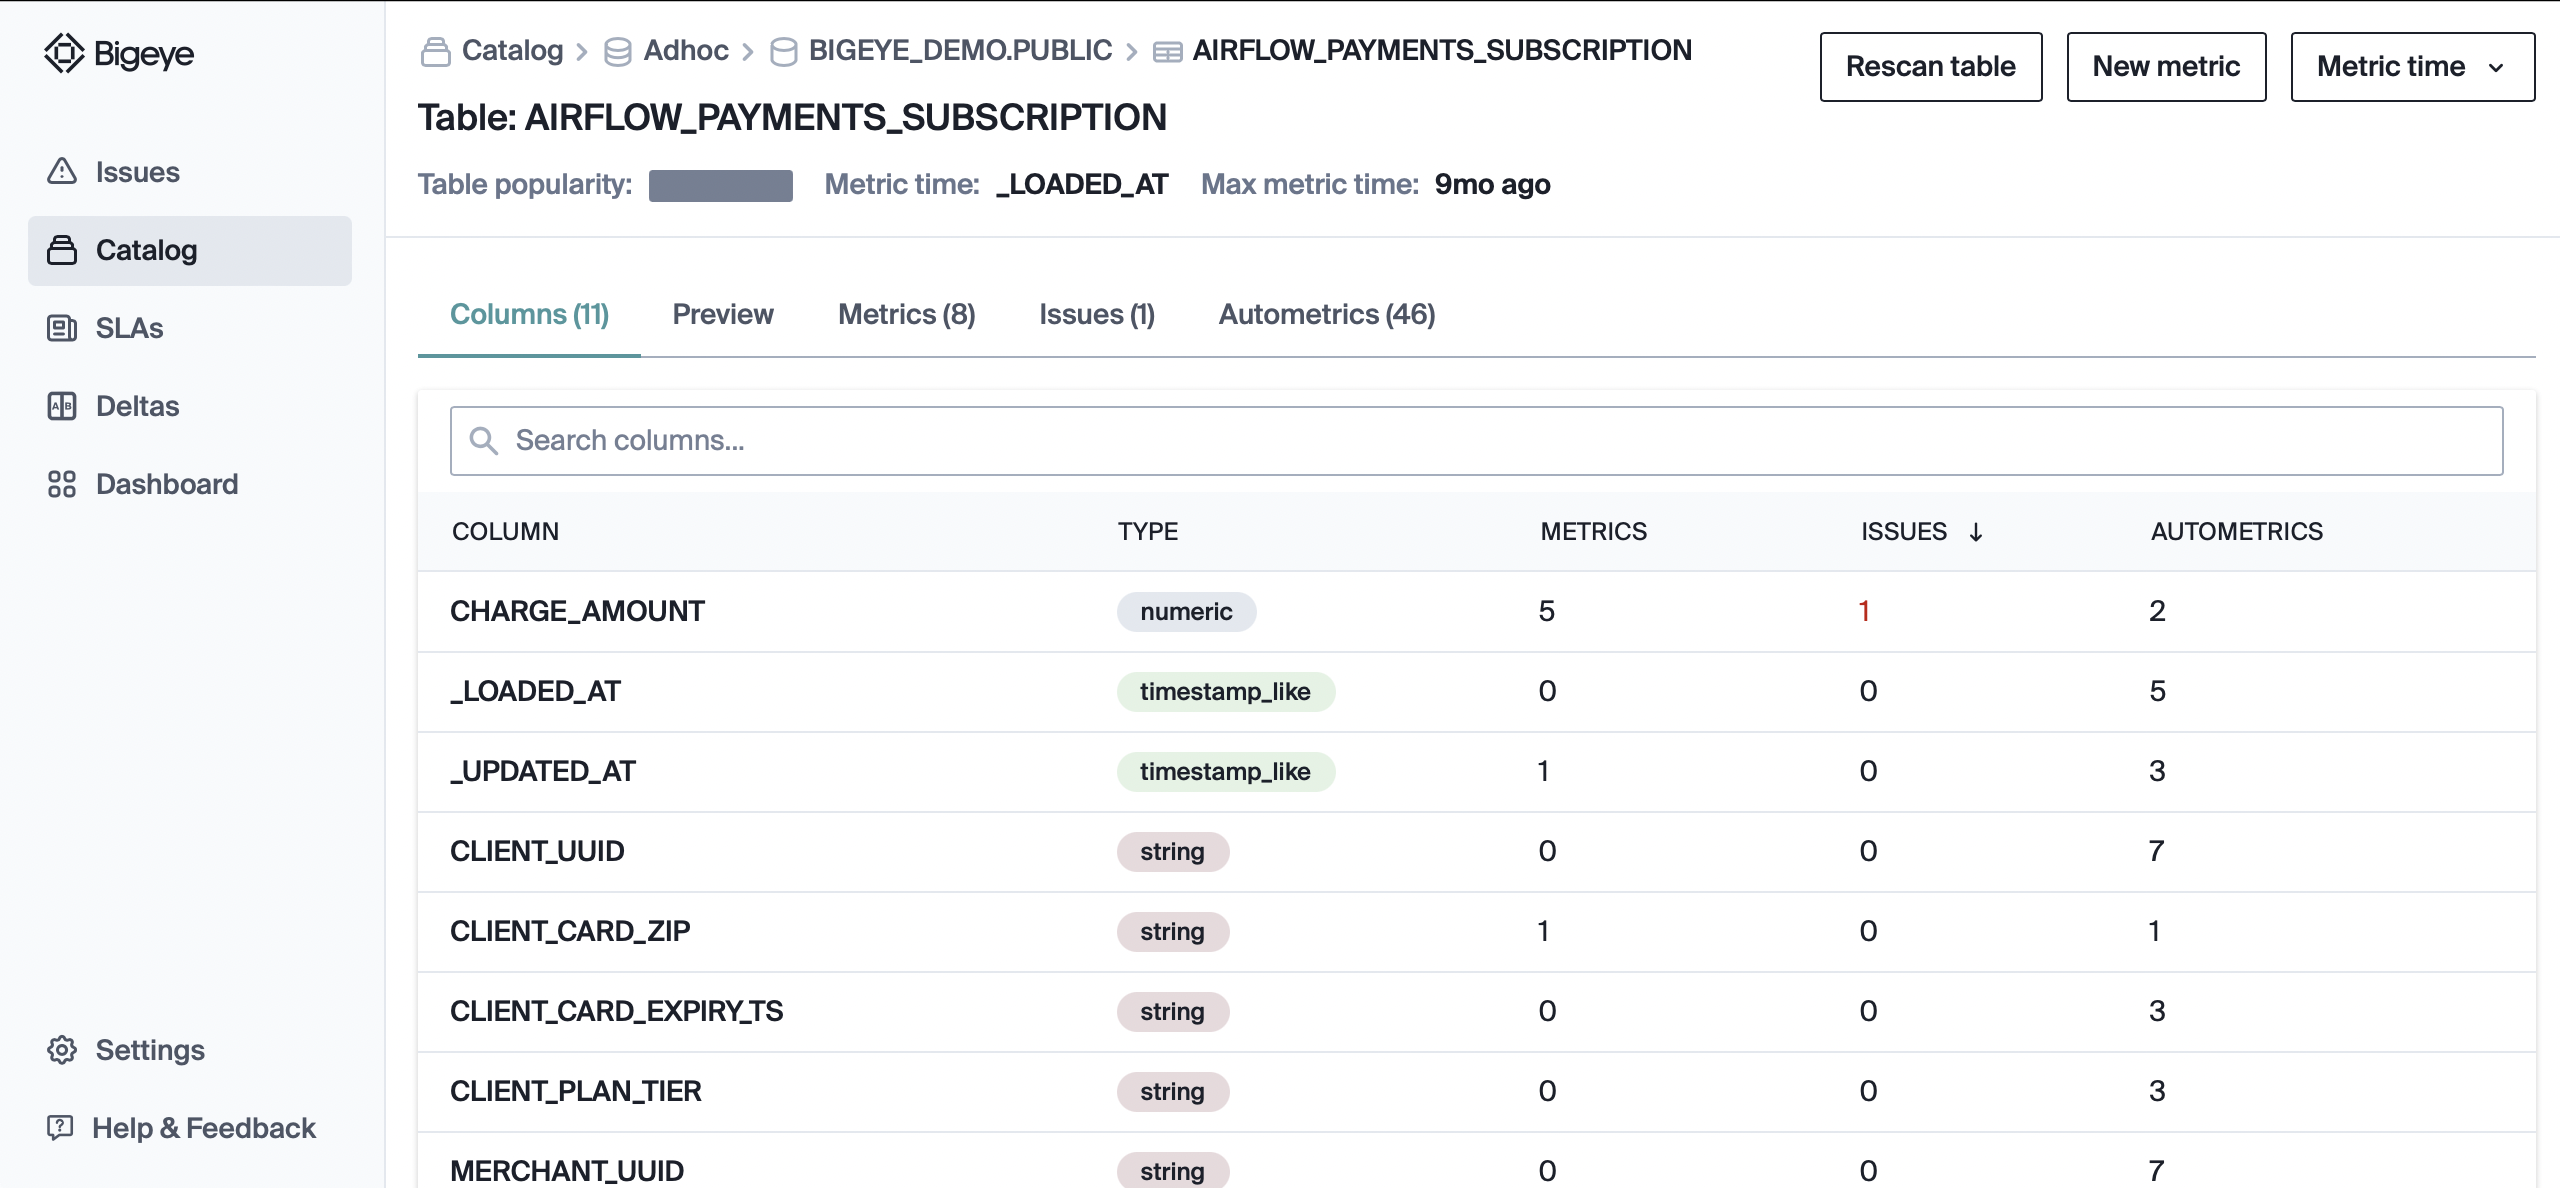
The AIRFLOW_PAYMENTS_SUBSCRIPTION table already has its metric time set. If you need help setting metric time, please refer to the metric time guide
There are two ways to create metrics:
- Autometrics
- Manually creating a metric
Autometrics
Autometrics are Bigeye's recommendations for common types of metrics that you can use to monitor columns in a database table. They include metrics like percentage null, freshness, and cardinality.
When you connect your database, Bigeye begins profiling your data to understand what it looks like. Bigeye can then generate Autometrics for the table, which you can find on the Autometrics tab of the table's catalog page.
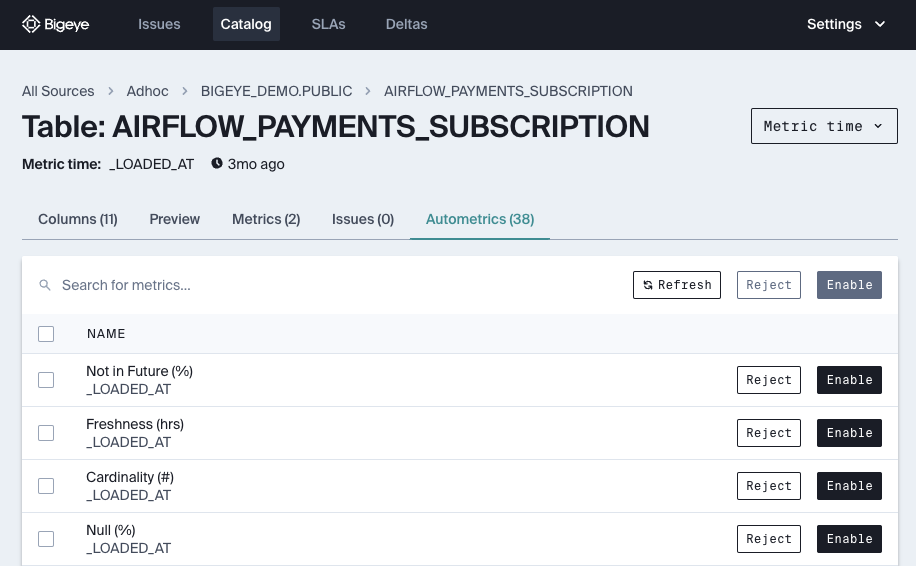
Deploying an autometric
Deploying an Autometric will create a metric, and if Metric Time is set for a table, begin backfilling the historical values for the metric. All Autometrics are deployed with autothresholds computed from historical data, and the backfilling process allows you to get accurate thresholds on the next run with no extra configuration.
Autometrics should cover a large portion of your monitoring, but for more specific checks, you can manually create metrics.
Manually creating a metric
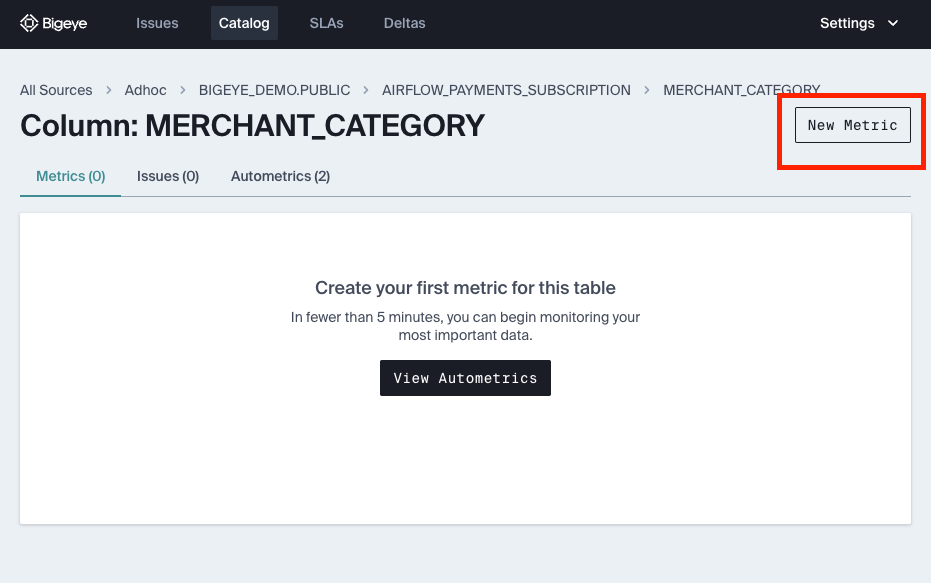
In order to manually create a metric, you must navigate to a specific column in your catalog and click on the New metric button:
The Metric edit page consists of two sections: the metric definition and the threshold definition.
The metric definition lets you define what metric you want to check, on what column, how often, and with what filters. Go here for a list of available metrics. If you have metric time set on the table that this metric is on, then you will automatically see a filter on the metric column, which defaults to 2 days of lookback.
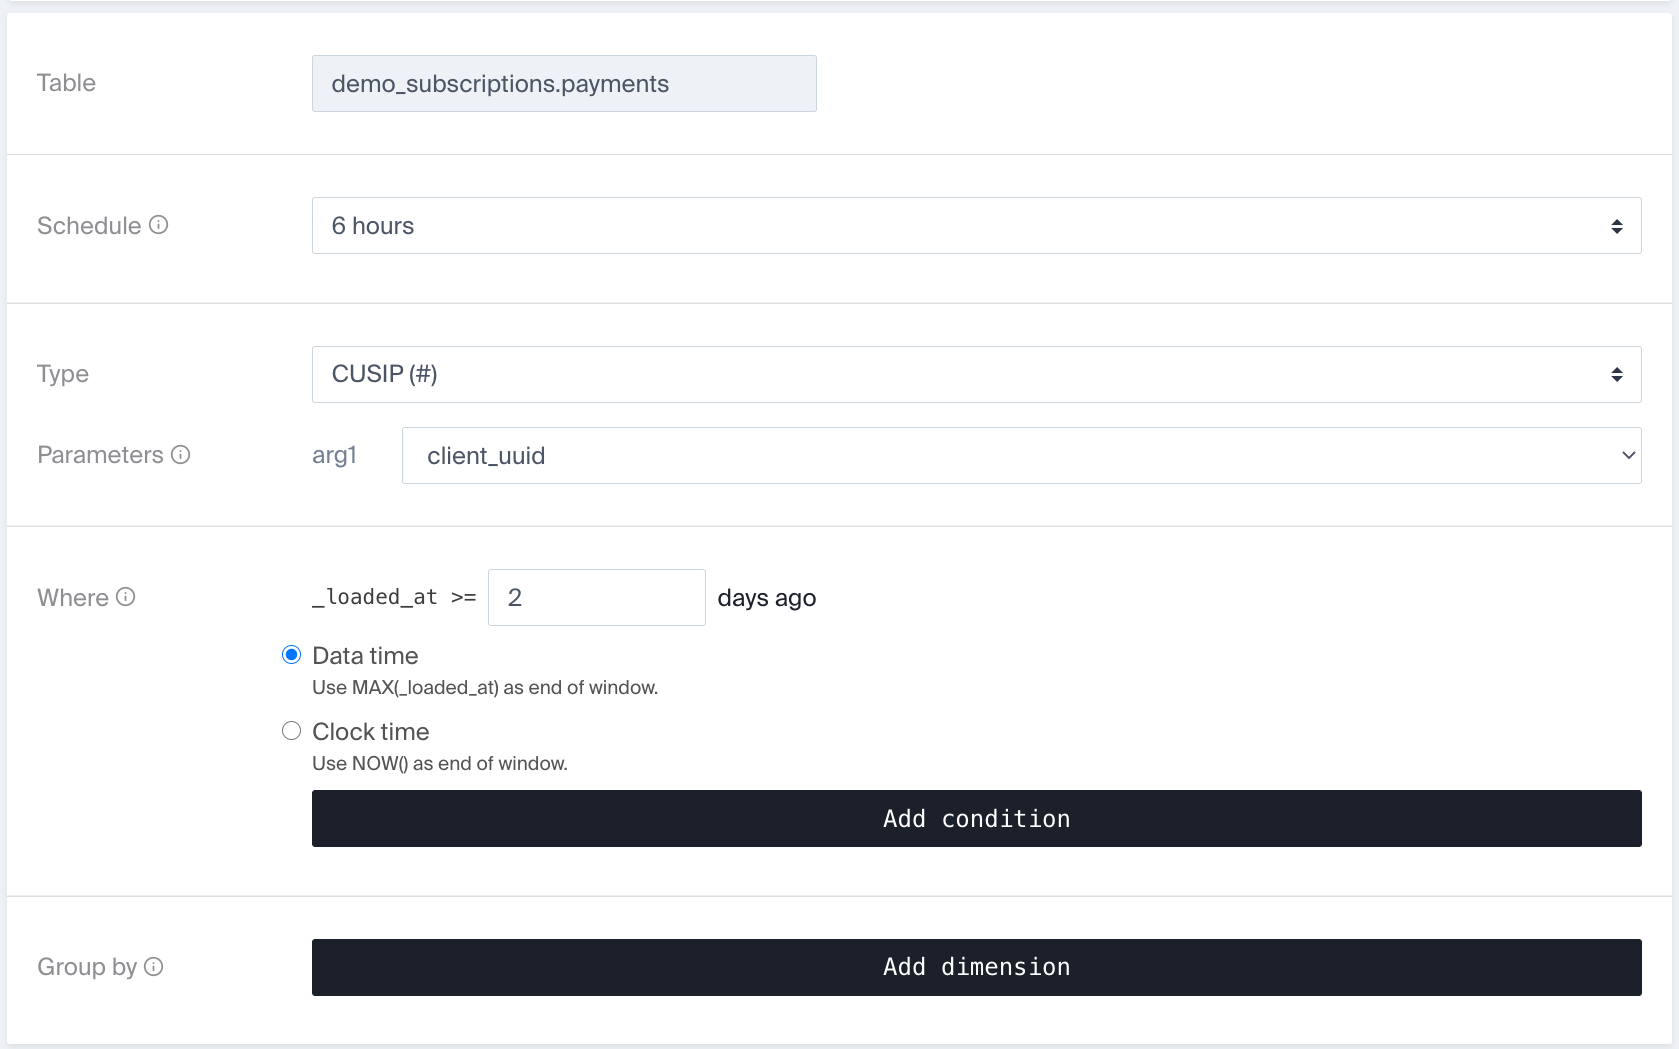
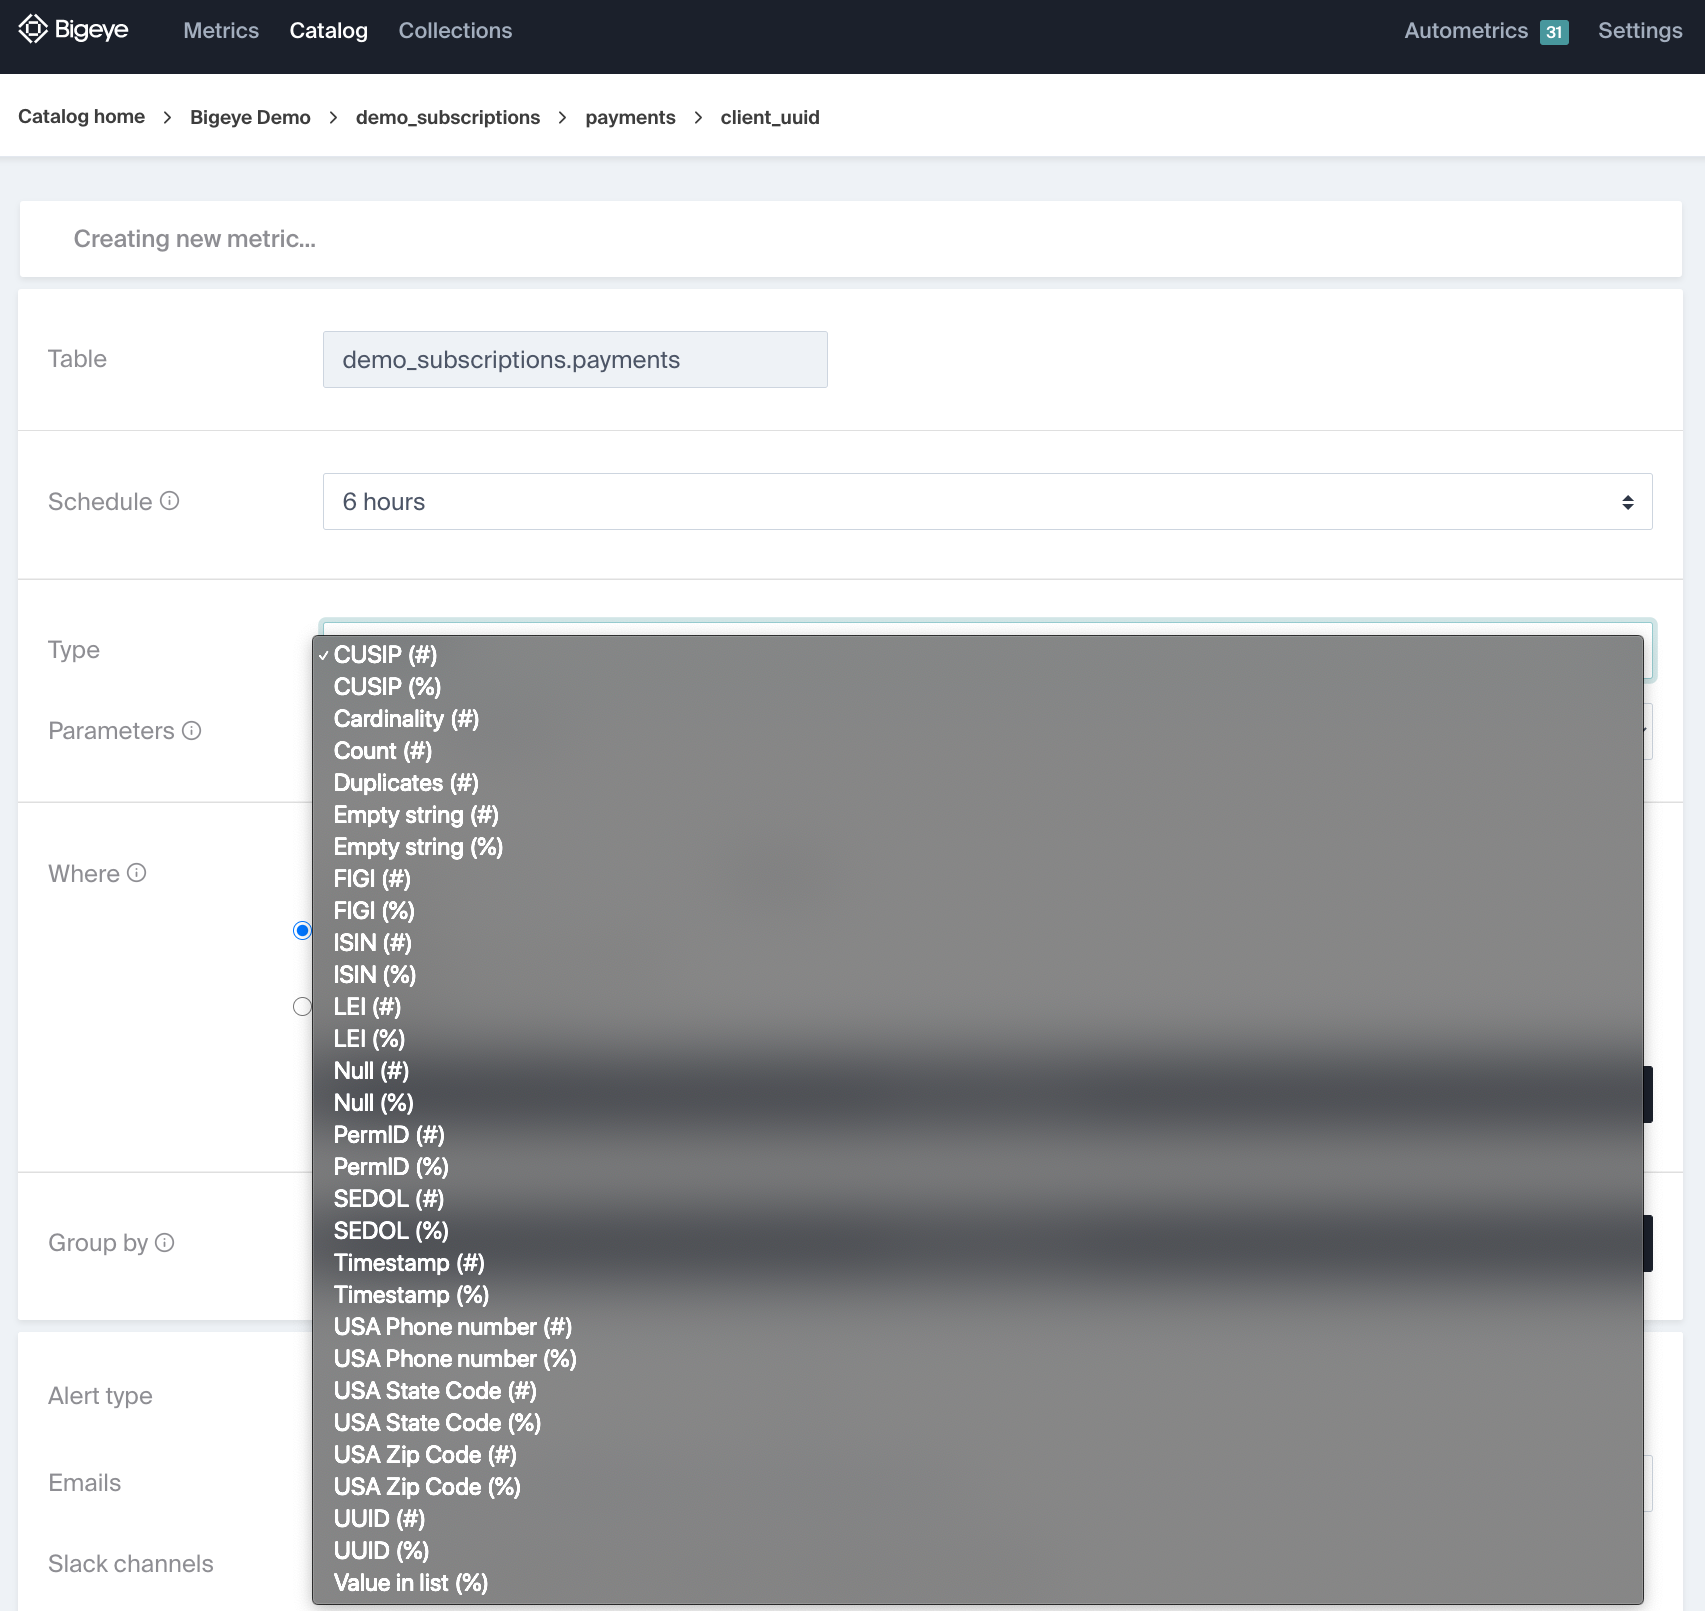
You can add your own filters, which are written as raw SQL WHERE conditions, by clicking the Add condition button.
The threshold definition section covers the thresholds that Bigeye should check for this specific metric. There are a few options here, listed under the Alert type dropdown menu:
You can set your own manual thresholds, or let Bigeye determine the correct ones by setting the selector to autothresholds.
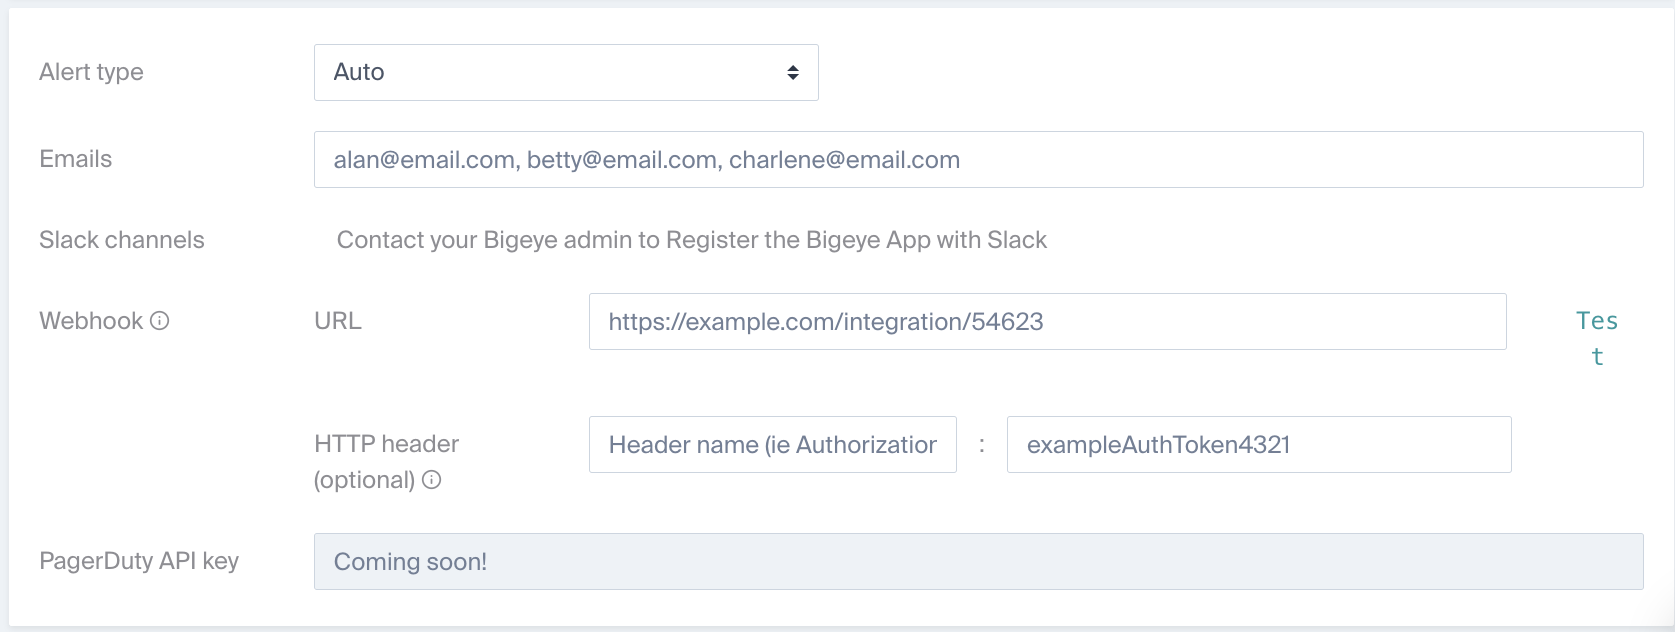
In this section, you can also define specific recipients for alerts coming from this metric, although we recommend defining your notification preferences through SLAs
Once you've saved your metric, it will begin collecting on the schedule you specified. Manually created metrics do not automatically backfill, however, you can trigger a backfill through the Backfill API.
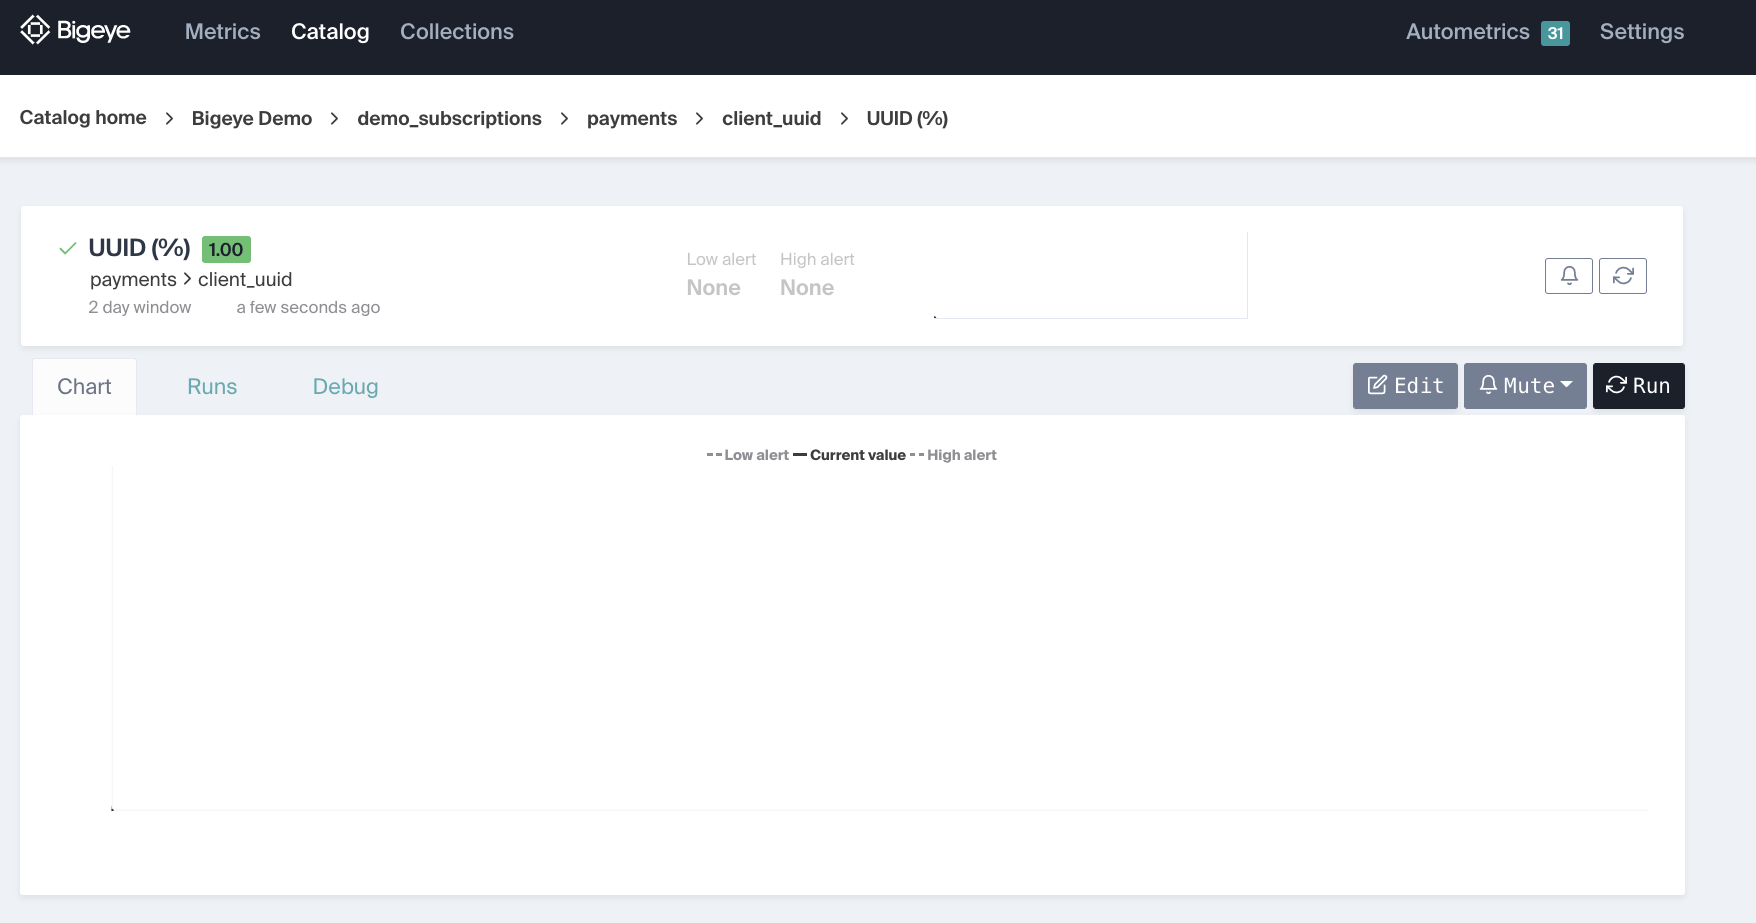
Editing metrics
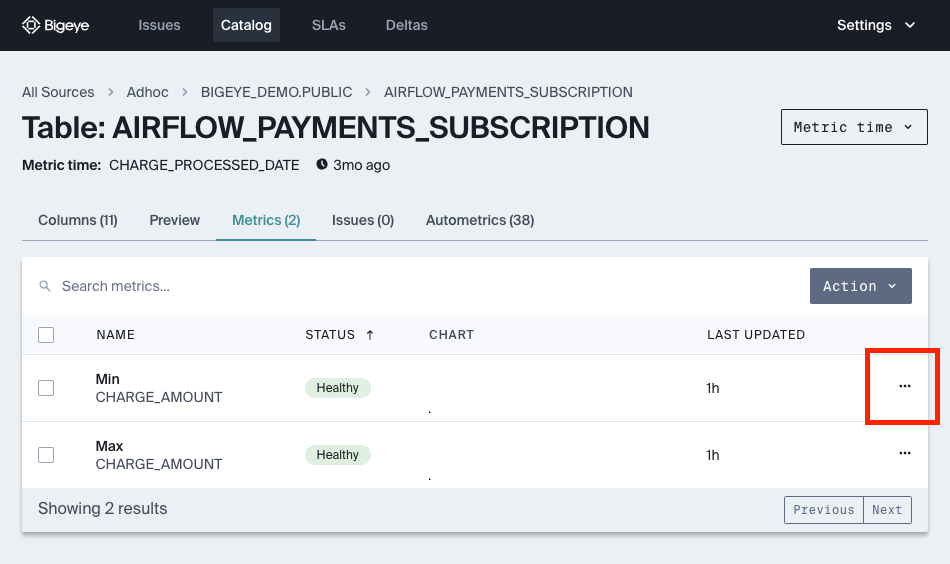
Clicking the three dots to the right side of the metric will take you to the Metric edit page. Here, you can make adjustments to your metrics, including grouping metrics, adjusting threshold sensitivity, and setting up time configuration. For more details, read on below.
Grouping metrics
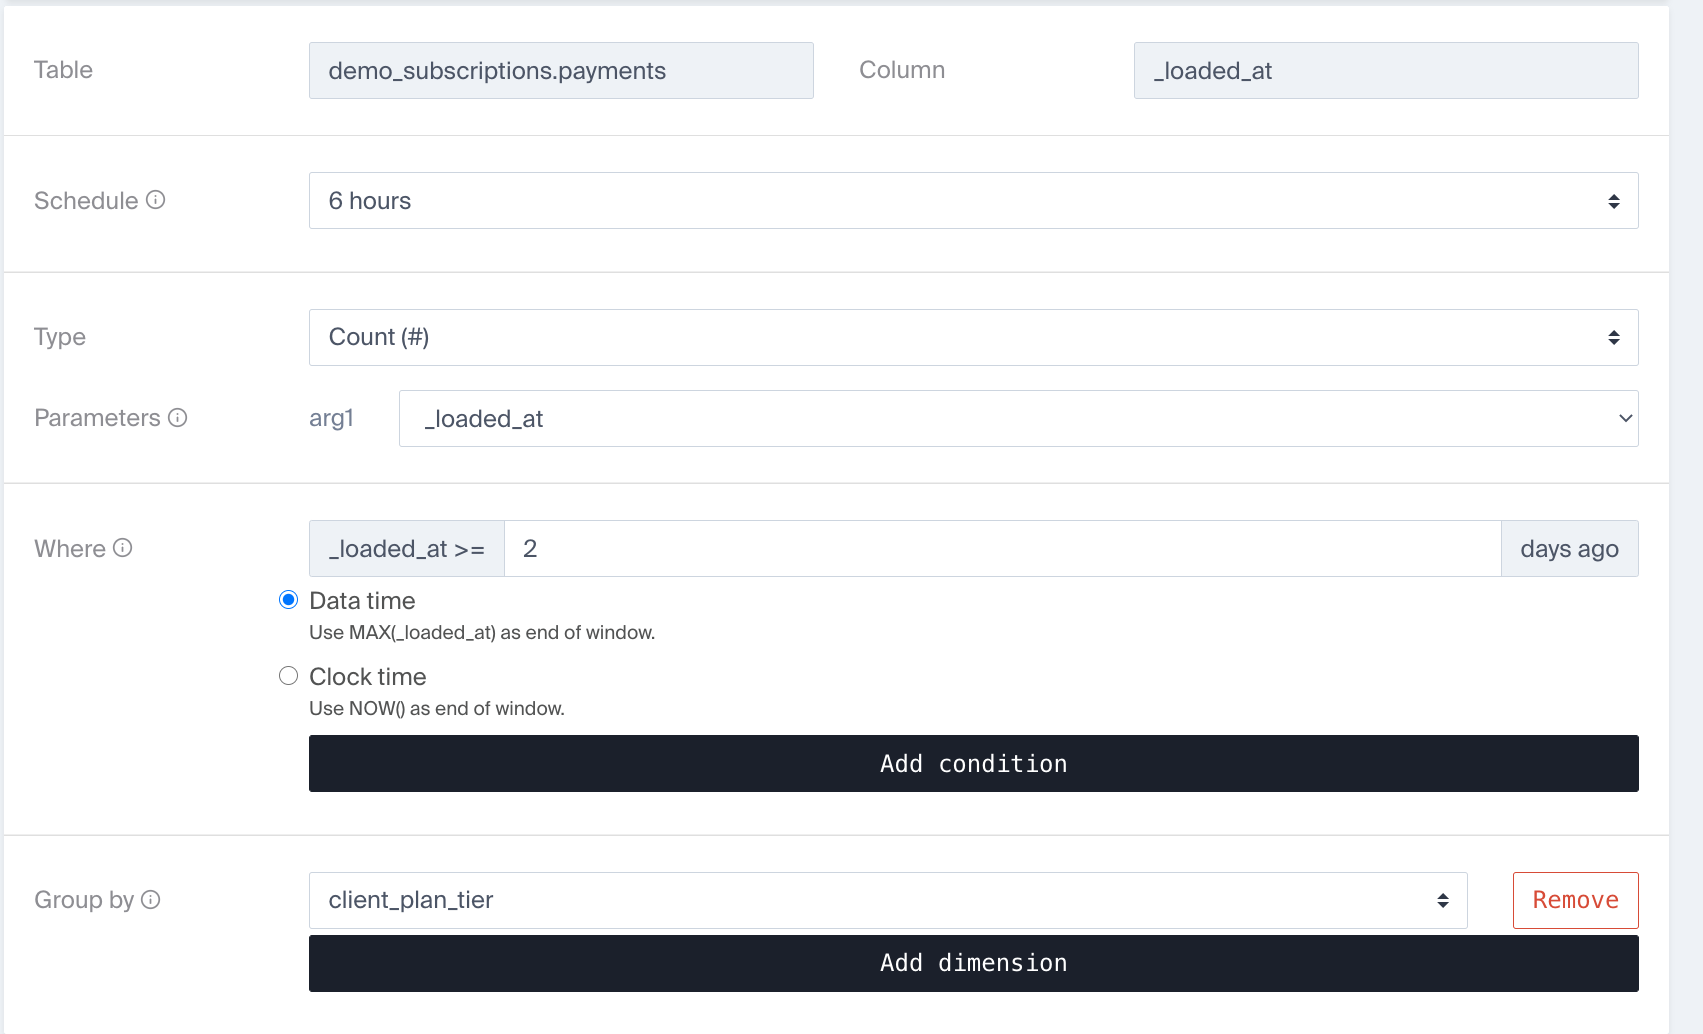
It's possible to create a grouped metric, which will create an individual metric for each unique tuple in the group by columns. This works exactly like SQL GROUP BY queries.
In order to create a grouped metric, on the Metric edit page, click the Add dimension button, and select the column that you want to group your metric by. Each individual group will get its own set of thresholds, alerting you if any specific groups are outside of bounds.
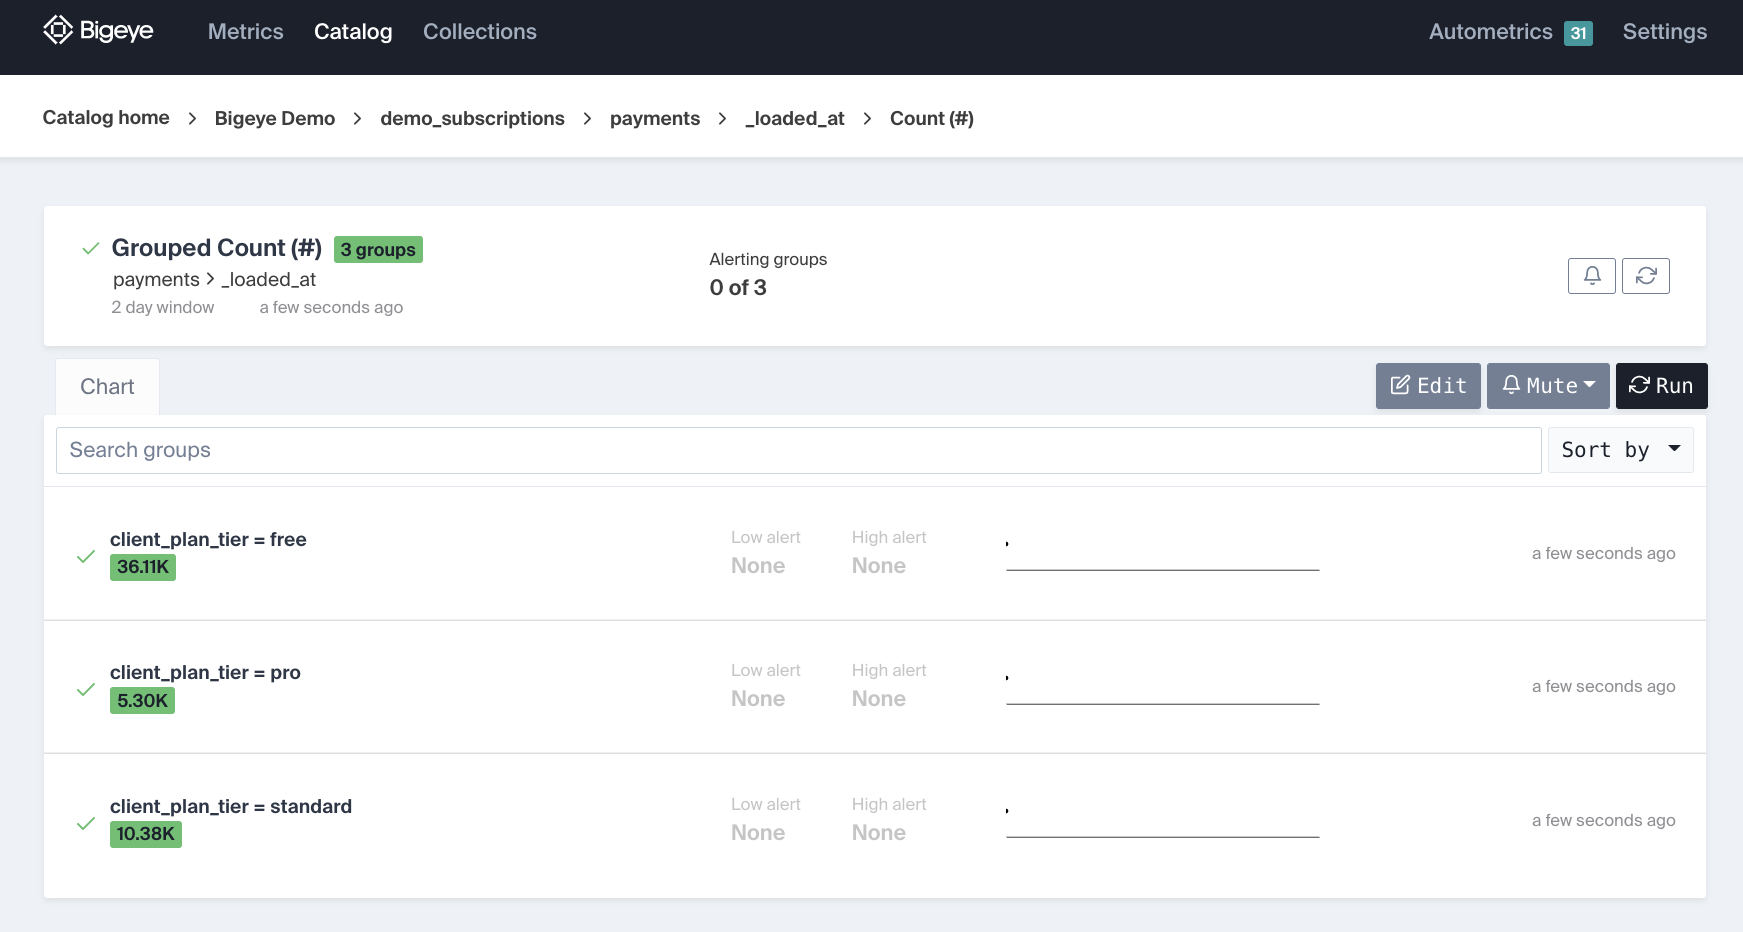
You can backfill grouped metrics as you would any other metric by referring to the Backfill API docs.
Filtering rows included
Recall that setting metric time limits the rows that will be included in those calculations, to only rows in a certain lookback window.
How does Bigeye determine which rows are from that lookback window? First, it automatically detects timestamp columns in your table and then asks you to pick one to use as reference. The column you select is the metric time column.
In the Metric edit page, you can adjust parameters relating to metric time in the Where box
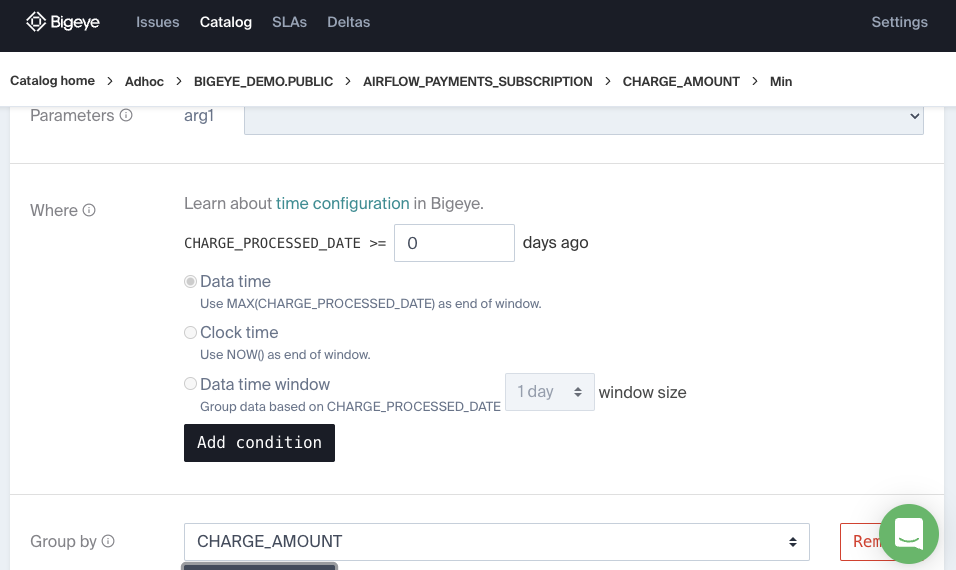
First, you will be asked to select how long the lookback window should be. A recommended default is two days.
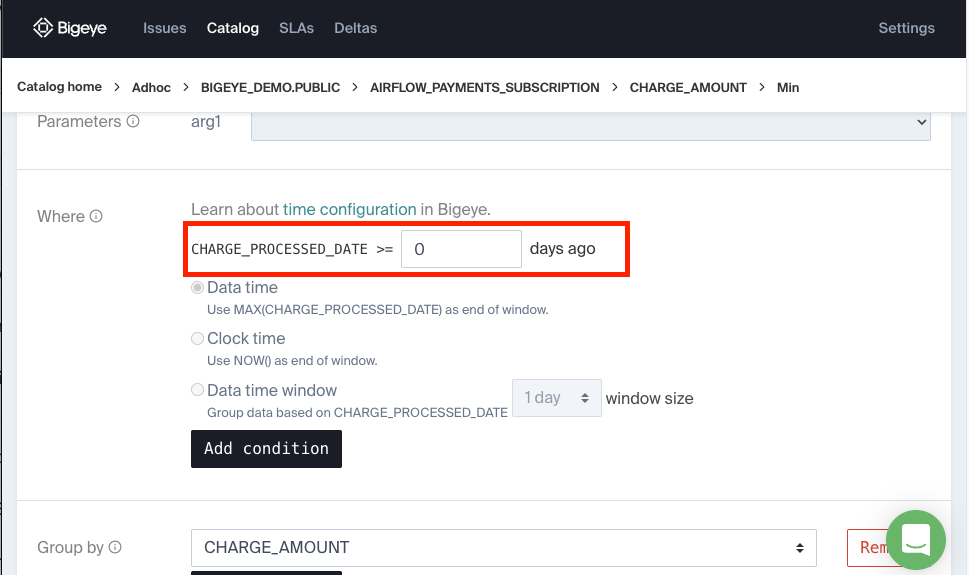
Next, you will be asked to select how the lookback window is computed. The three main options are:
When a metric is set to data time, Bigeye will look at the max value of the metric time column, and compute the window backward from that point.
When a metric is set to clock time, Bigeye will compute the window backward from the current execution time.
Data time window uses the same lookback window as data time, but also buckets the data into hour-long or day-long "windows", and computes the target metric over each of them. (If any of the buckets are anomalous an alert is sent.)
Updated 6 months ago
