

Lineage Plus
Fully automated column level lineage for modern and legacy data sources.
Lineage Plus enables column level mapping of data flows across and within systems including transactional databases, data warehouses, data lakes and lakehouses, ETL platforms, and business intelligence tools.
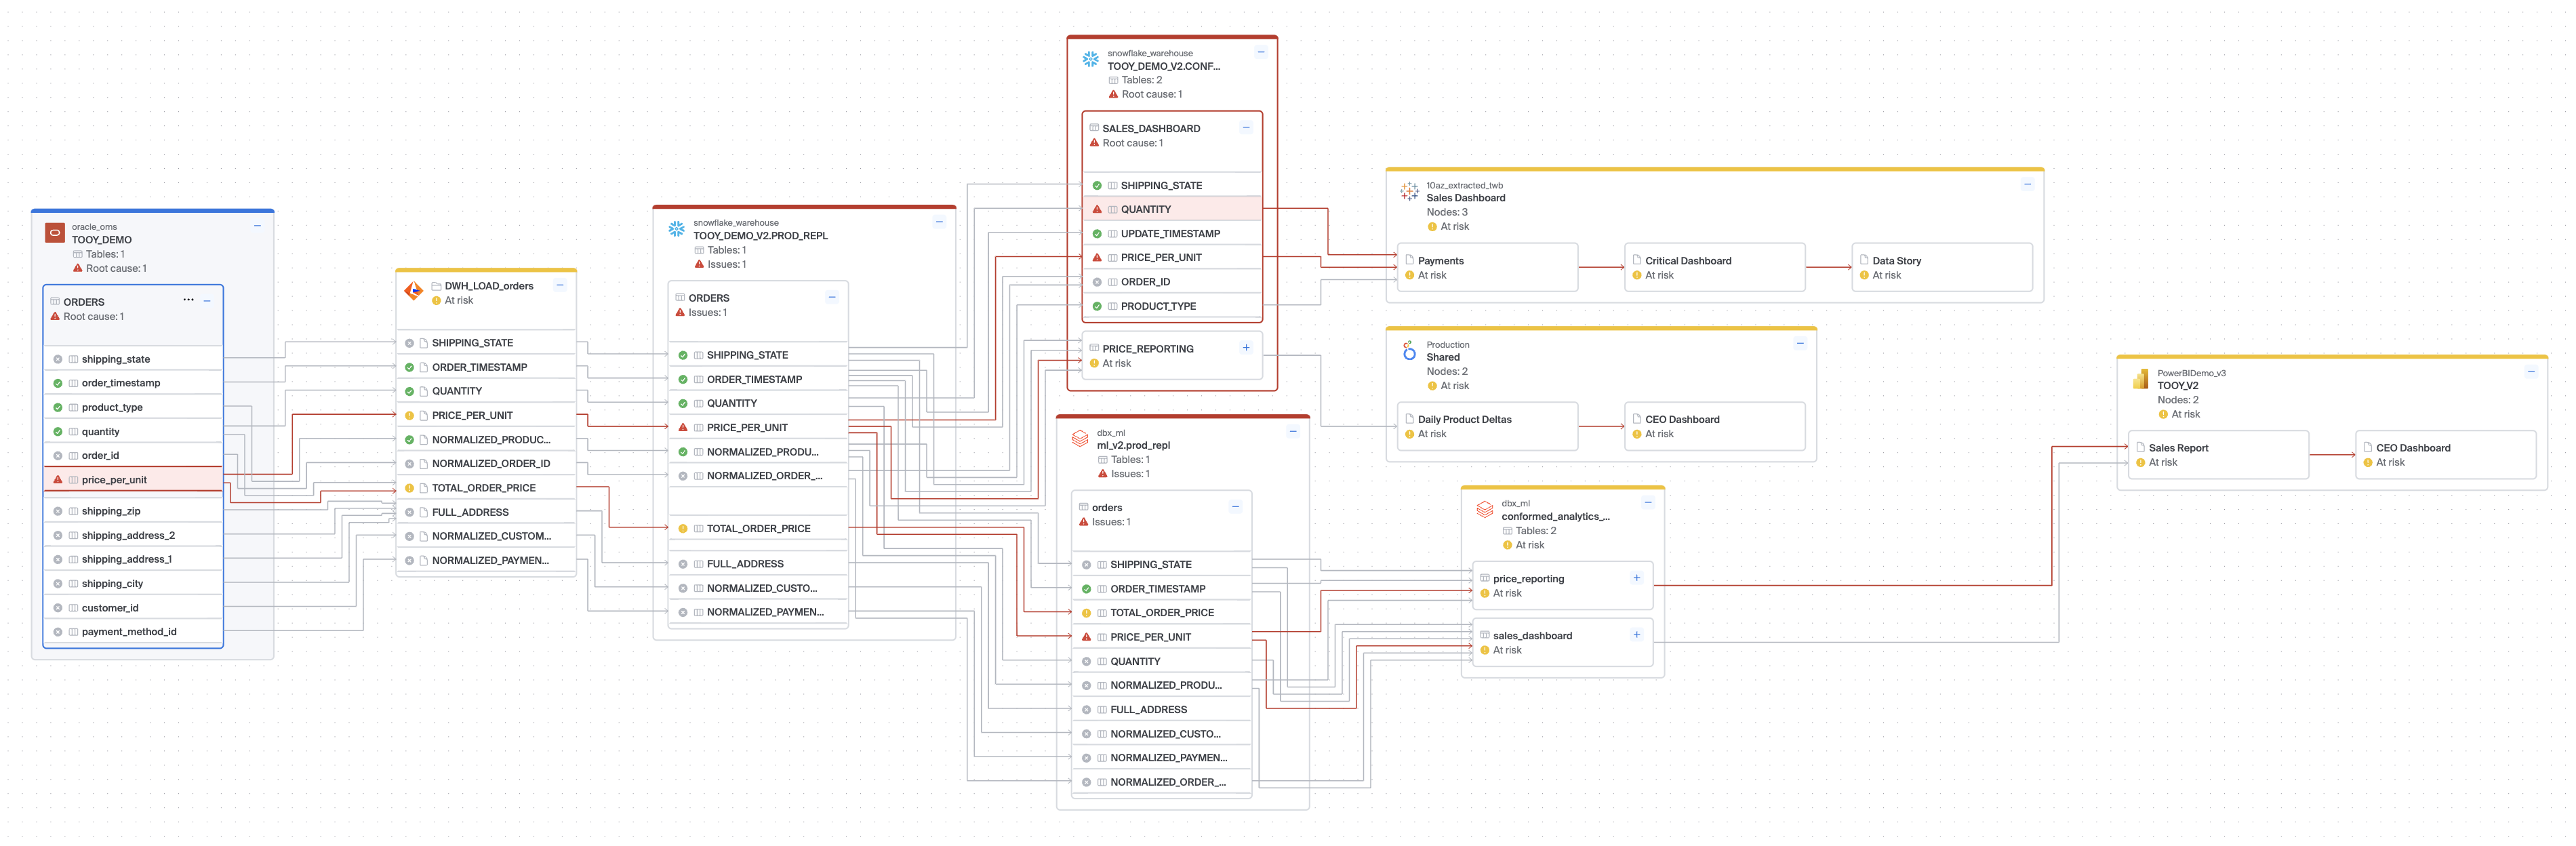
Lineage is a critical component of data observability and enables several key workflows such as deploying upstream monitoring, impact analysis, root cause analysis, and incident management.
Lineage Plus Connectors
All connectors parse lineage at the column level and do not require manual mappings. When Data Transformation connectors are installed, lineage can be traced across sources automatically to create end-to-end lineage. Browse the full list of available connectors in Database Connectors, ETL Connectors, and BI Connectors.
New connectors are available on a near monthly basis. To inquire about a new connector please contact [email protected].
Lineage Displays
Bigeye provides several display modes for exploring lineage graphs. You can switch between displays using the display dropdown in the lineage toolbar. Your selected display persists across page loads and sessions.
Display types
Lineage graphs support multiple view types that control what data is overlaid on the graph:
- Observability — Displays metric status and issue counts on each node. Nodes are color-coded to indicate data health.
- Classification — Overlays data sensitivity classifications on nodes. A classification legend is displayed to help interpret classification levels.
- Lineage only — Shows the lineage graph without any data overlay, for a clean structural view.
Lineage graph controls
The lineage graph header provides controls for navigating large graphs:
- Expand all nodes — Expands every node currently on the graph at once.
- Collapse all nodes — Collapses every expanded node currently on the graph at once.
- Full screen — Expands the lineage graph to fill the browser window, making it easier to navigate large graphs.
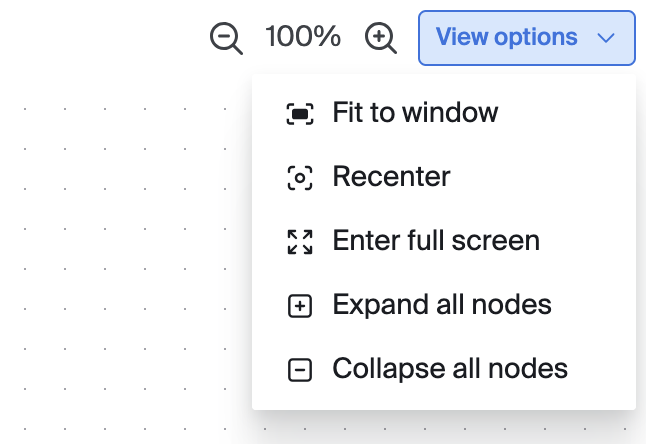
Table-level and column-level lineage
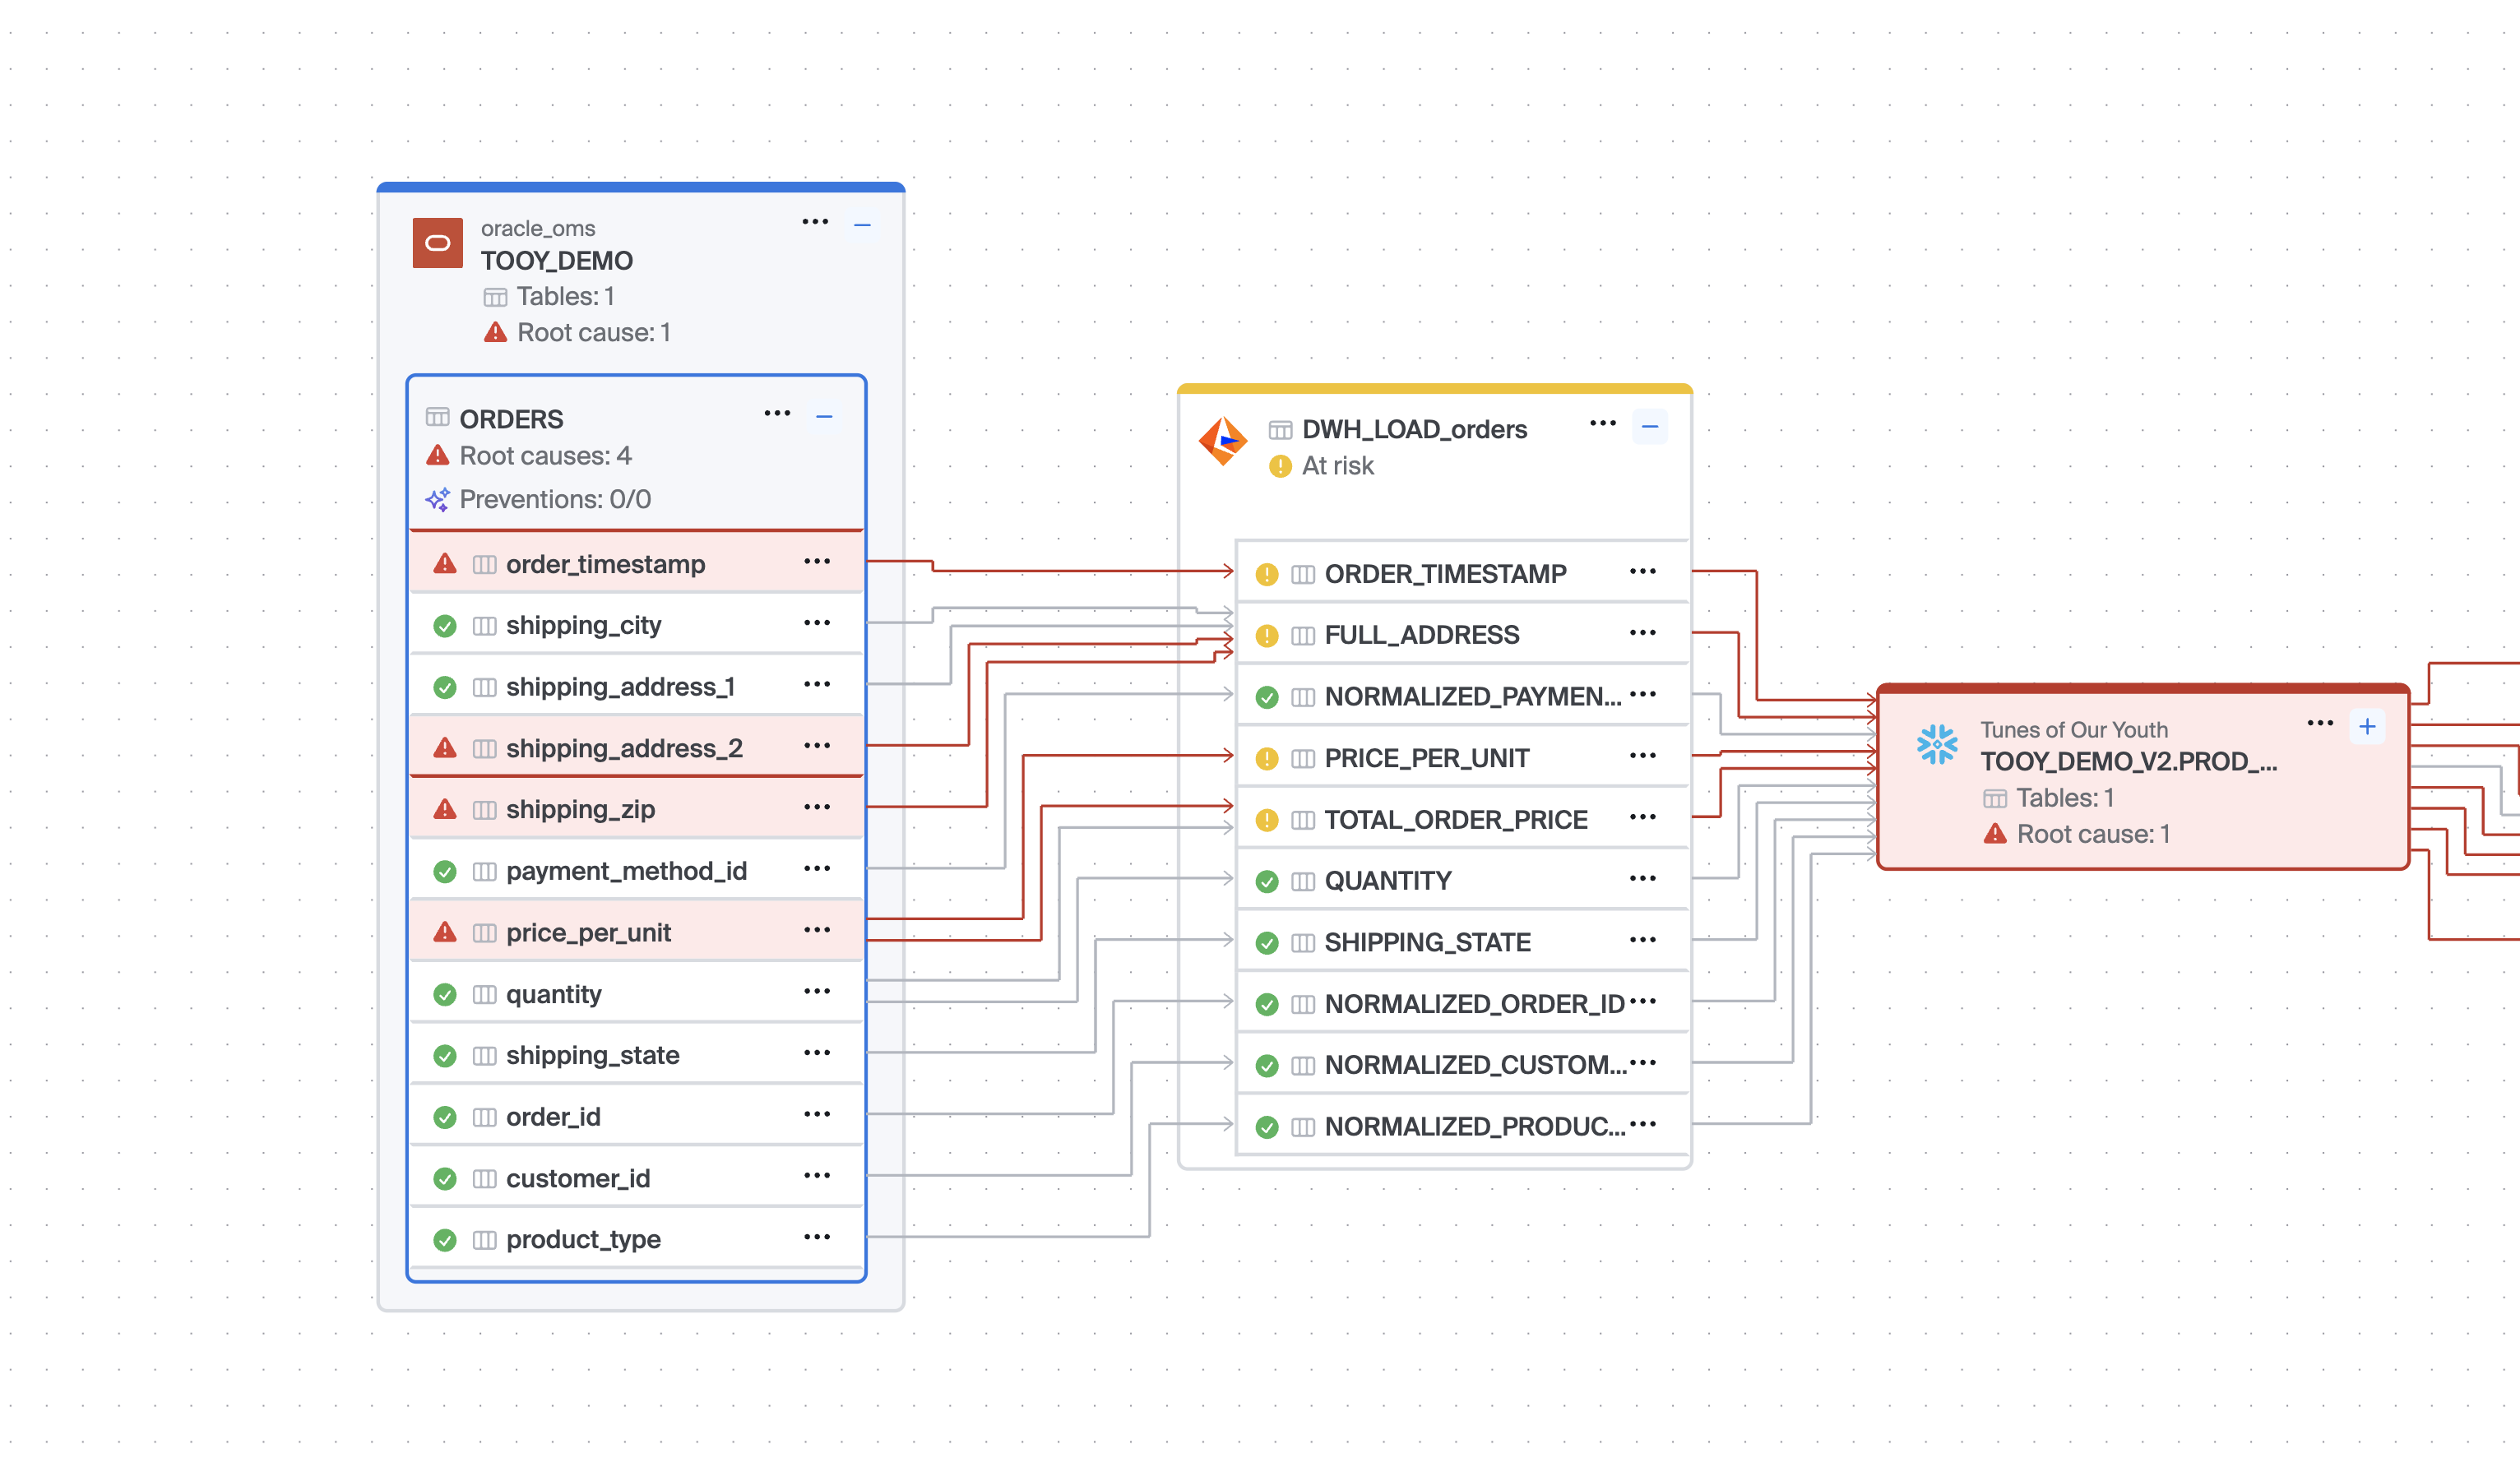
By default, lineage graphs display table-level connections. You can expand individual table nodes to reveal column-level lineage on demand, without switching to a full column-level graph. This lets you inspect specific column flows while keeping the broader table-level context visible.
When you expand a node, a Show more nodes control appears on that node so you can progressively load additional upstream or downstream nodes as needed, rather than loading the entire graph at once.
Filtering and exporting lineage
- ETL node filtering — Hide ETL transformation nodes to simplify the graph and focus on source-to-destination flows.
- CSV export — Export the nodes or edges of a lineage graph as CSV for offline analysis or sharing. See the Exporting Lineage page for more details about CSV exports.
- Share link — Generate a shareable link to a specific lineage view.
Snapshots
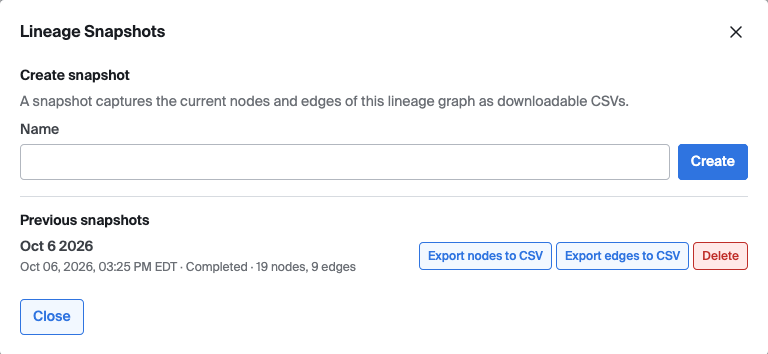
Snapshots allow you to capture a graph at a state in time. These stored graphs can be retrieved as CSV by name.
To access the snapshots feature, click on Actions > Snapshots
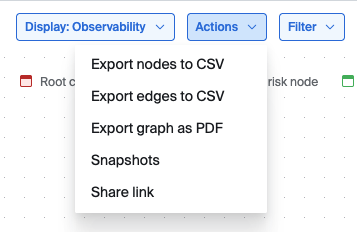
From the snapshots modal, one may create a new snapshot with a name and manage existing snapshots.
Updated 13 days ago