
View Issue Details
The issue detail page shows you all the key details about the issue including when it occurred, the downstream impacted analytics, tables, and data stewards, and a summary generated by bigAI.
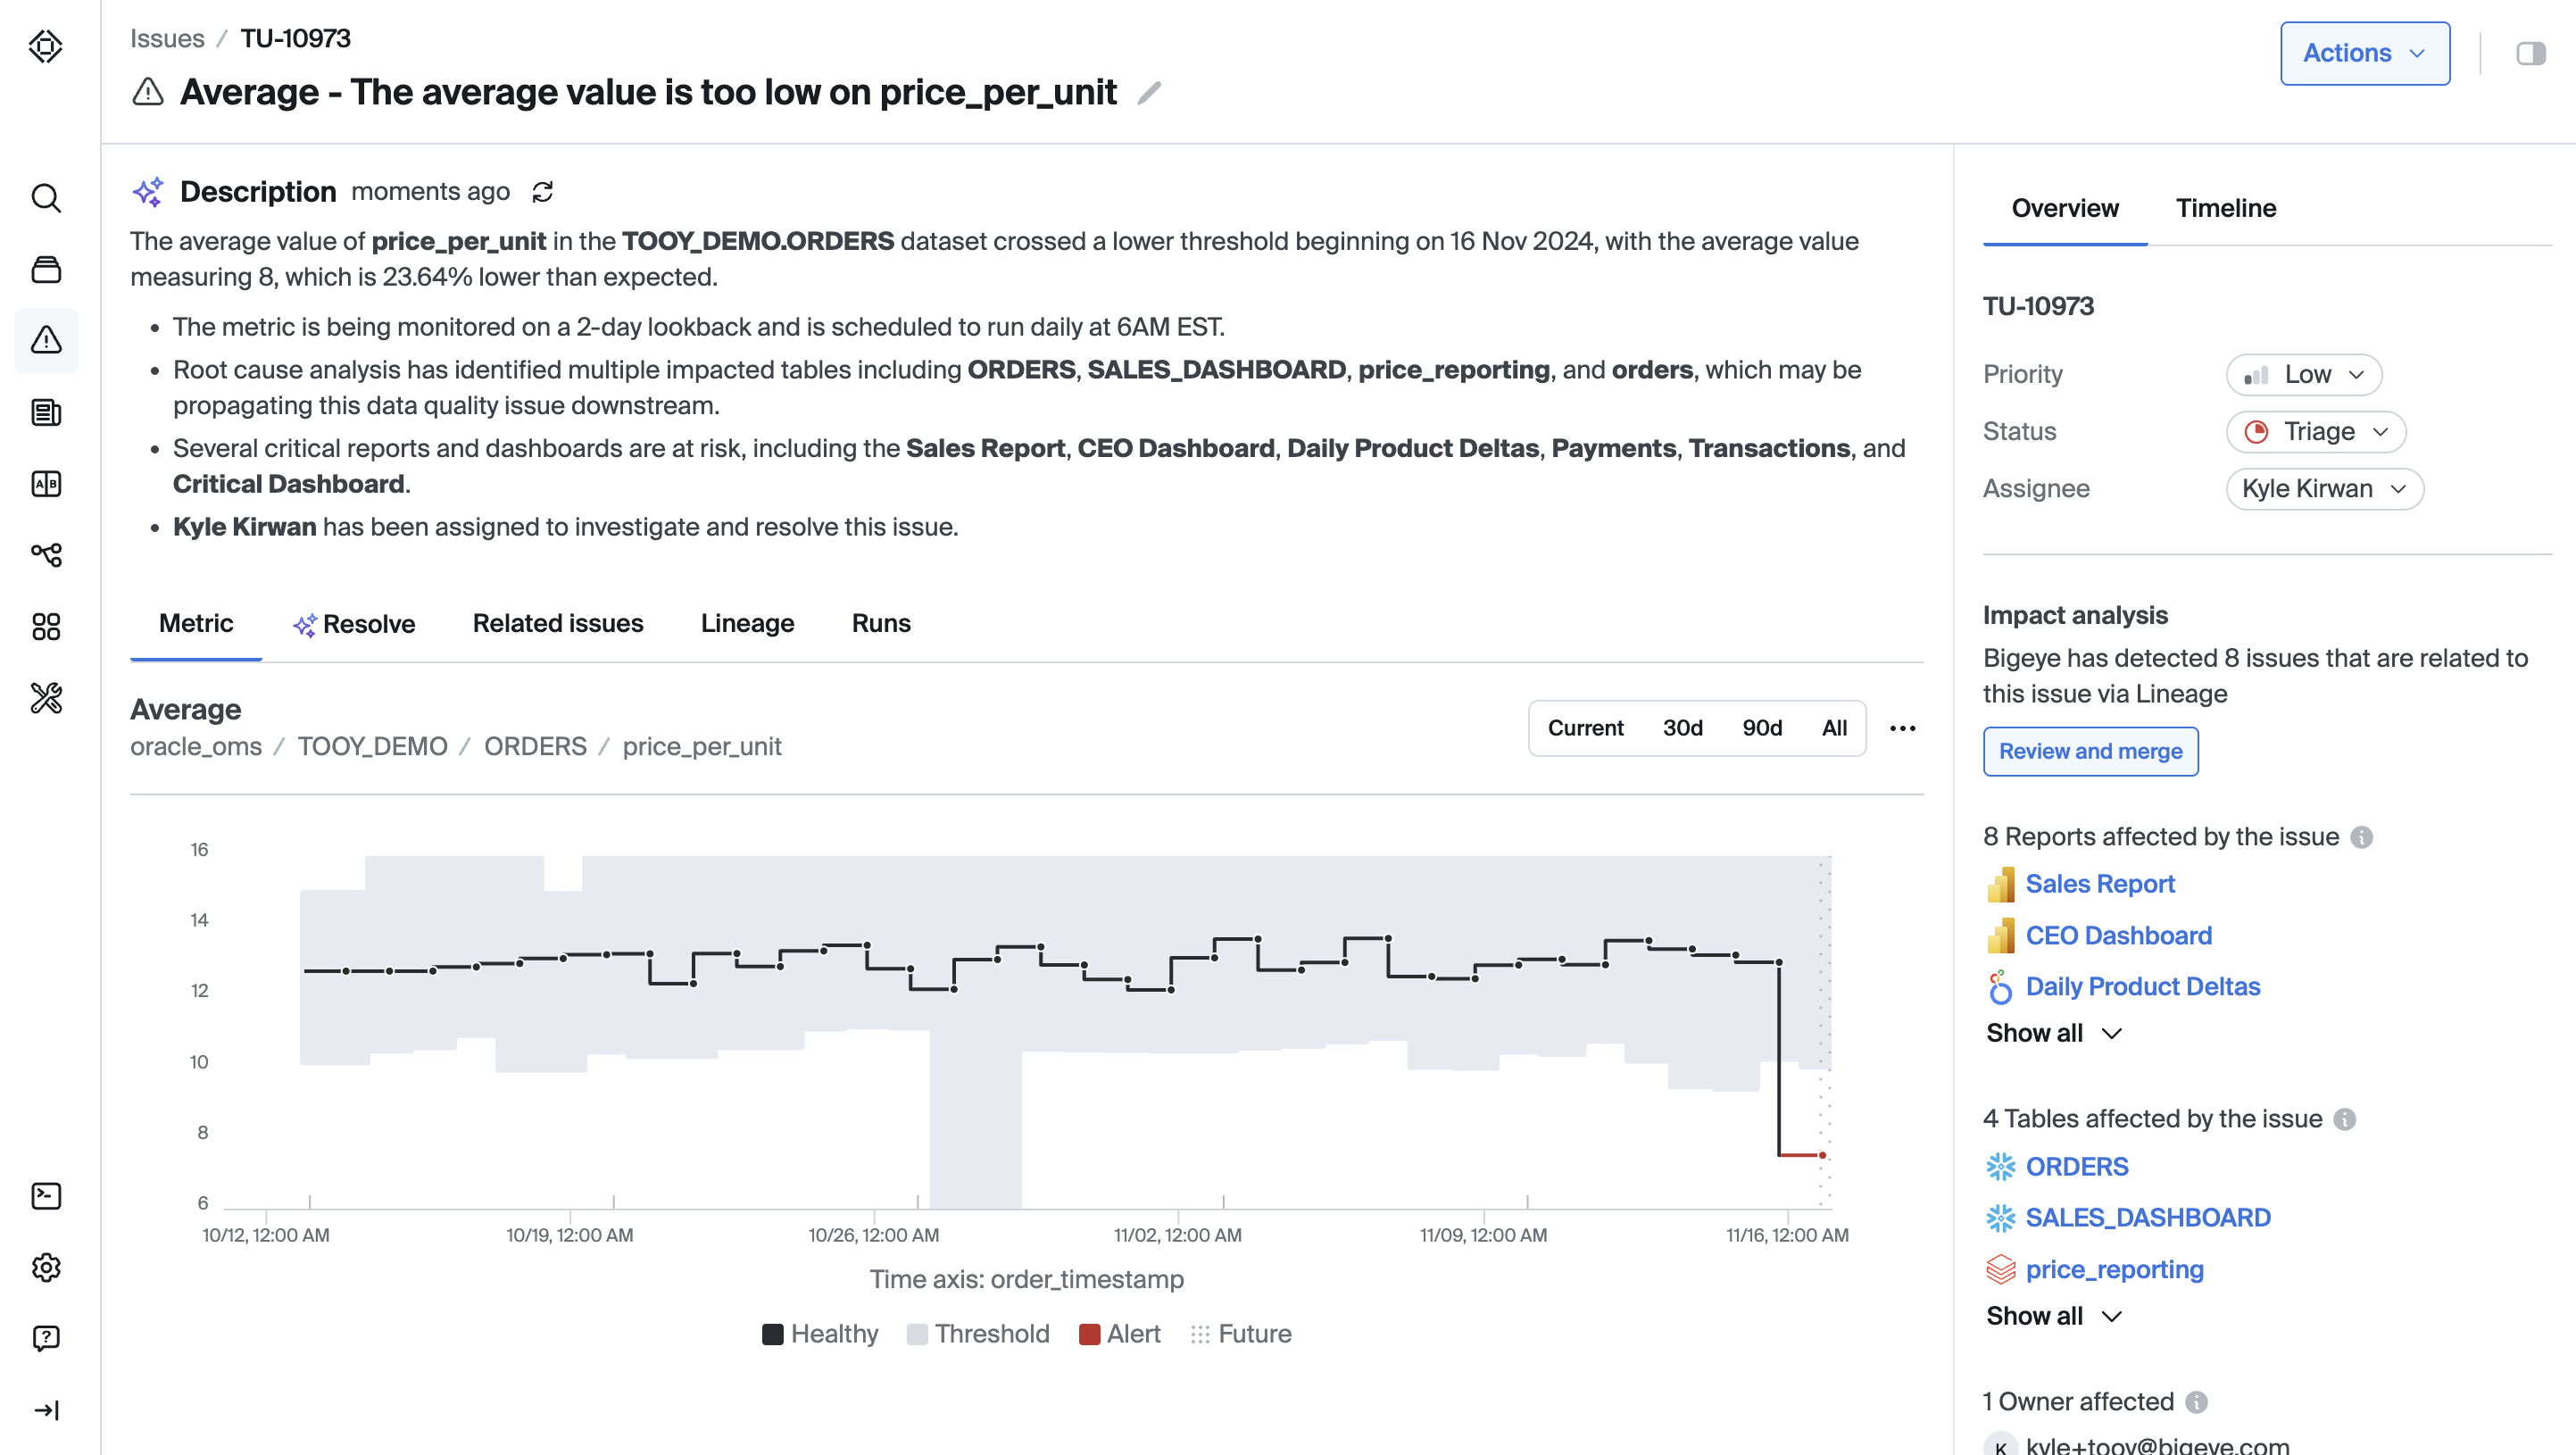
Issue Description
Issues descriptions are generated using bigAI based on a variety of metadata available about the issue including when and where it occurred, past related issues, downstream impact analysis, upstream root cause analysis and more. If bigAI is not enabled on your account, simple descriptions are generated using a fixed algorithm instead of generative AI.
Descriptions can also be edited manually if needed.
Right-hand Pane
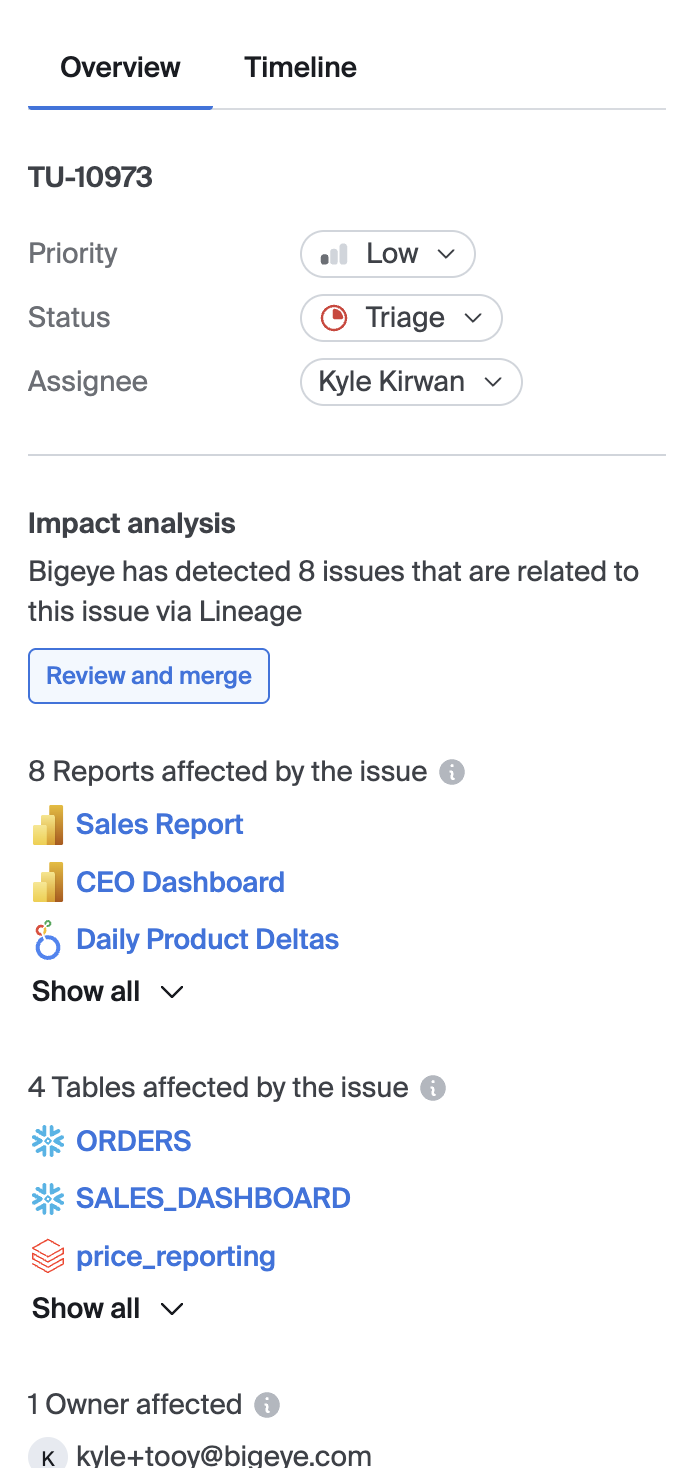
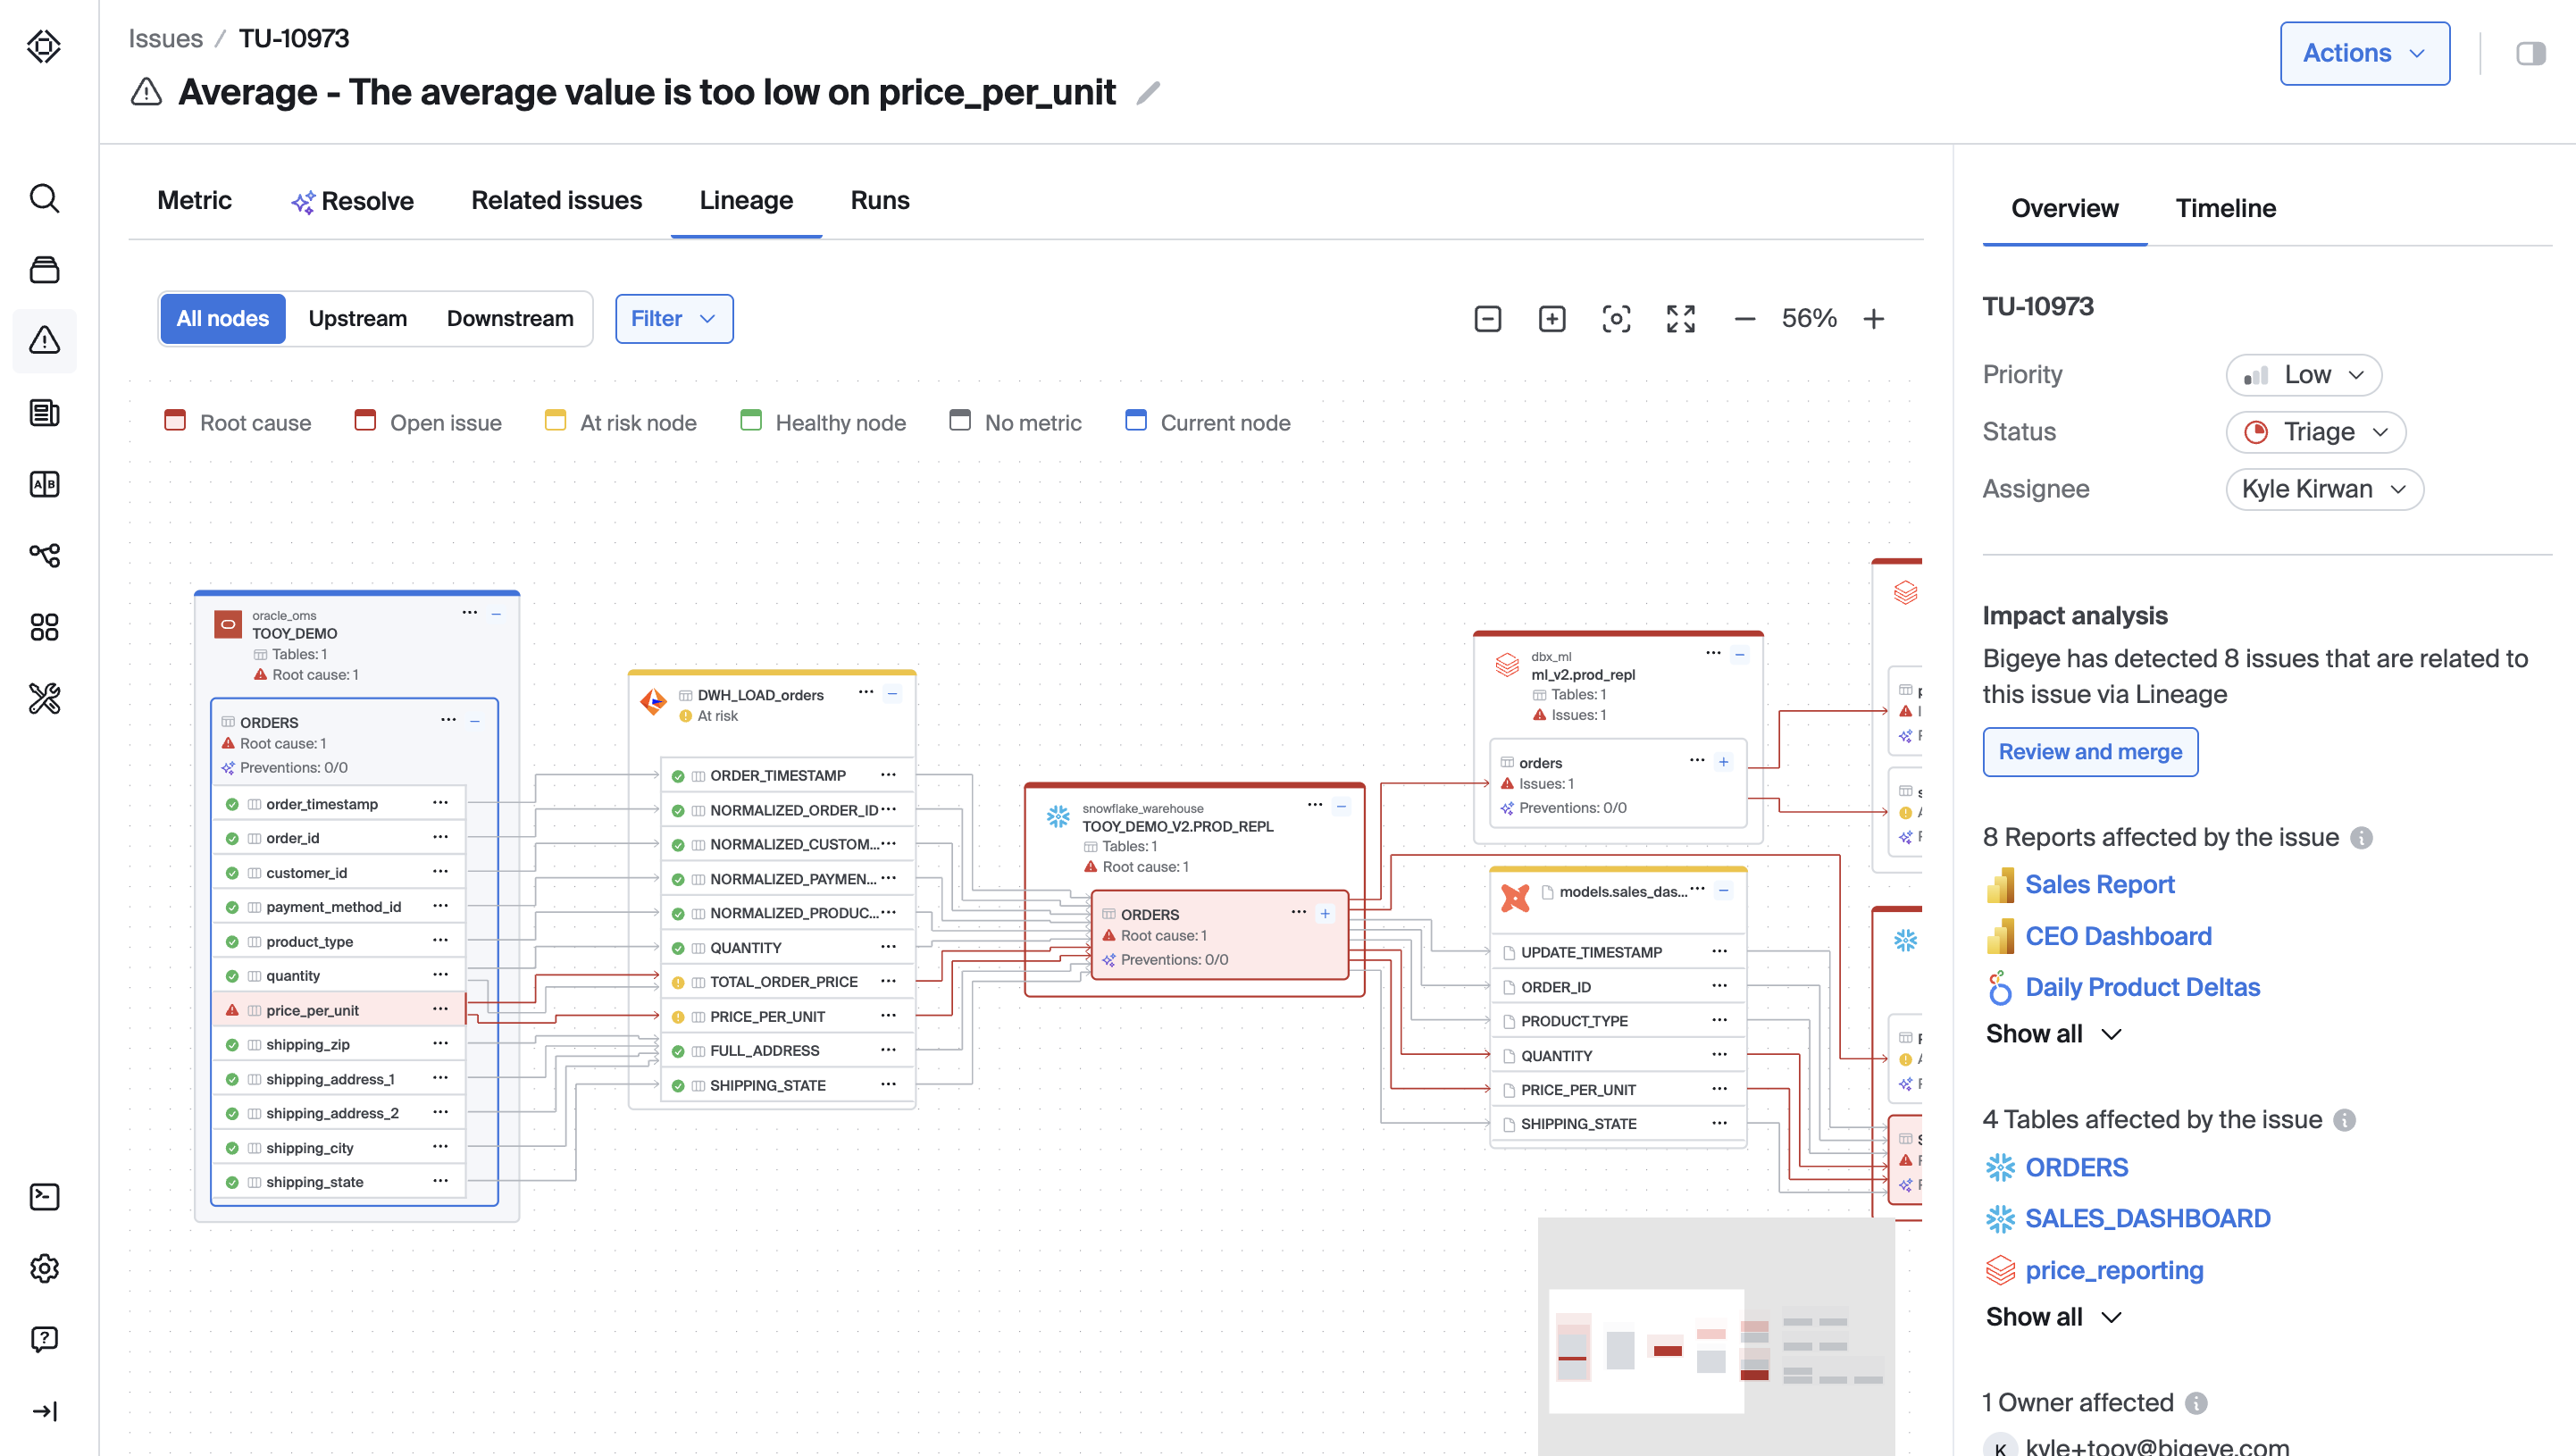
Overview
The overview section includes key information about the issue including the priority, status, and assignee. These can be modified by clicking their dropdown menus. Additional sections in this tab contain more information to help understand the root cause, impact, and notification strategy for this issue.
- Issue Ticket Information
- Impact Analysis
- Root Cause Analysis
- Metric Configuration
- External Tickets (e.g. Jira / ServiceNow integration)
- Slack Channels
- Collections
- Schema Changes to the impacted table
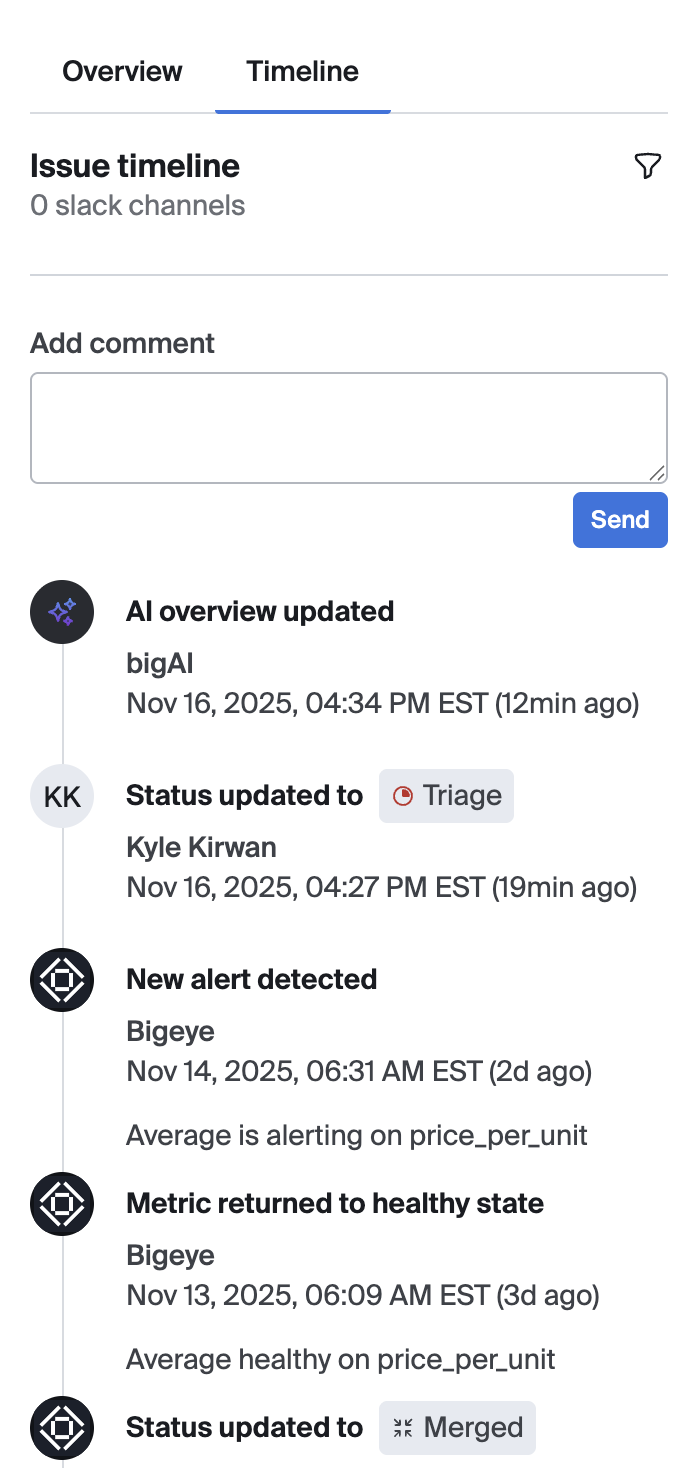
Timeline
The timeline view shows a history of all updates about the issue, including new alerts, comments from users, and other status changes.
Tabs
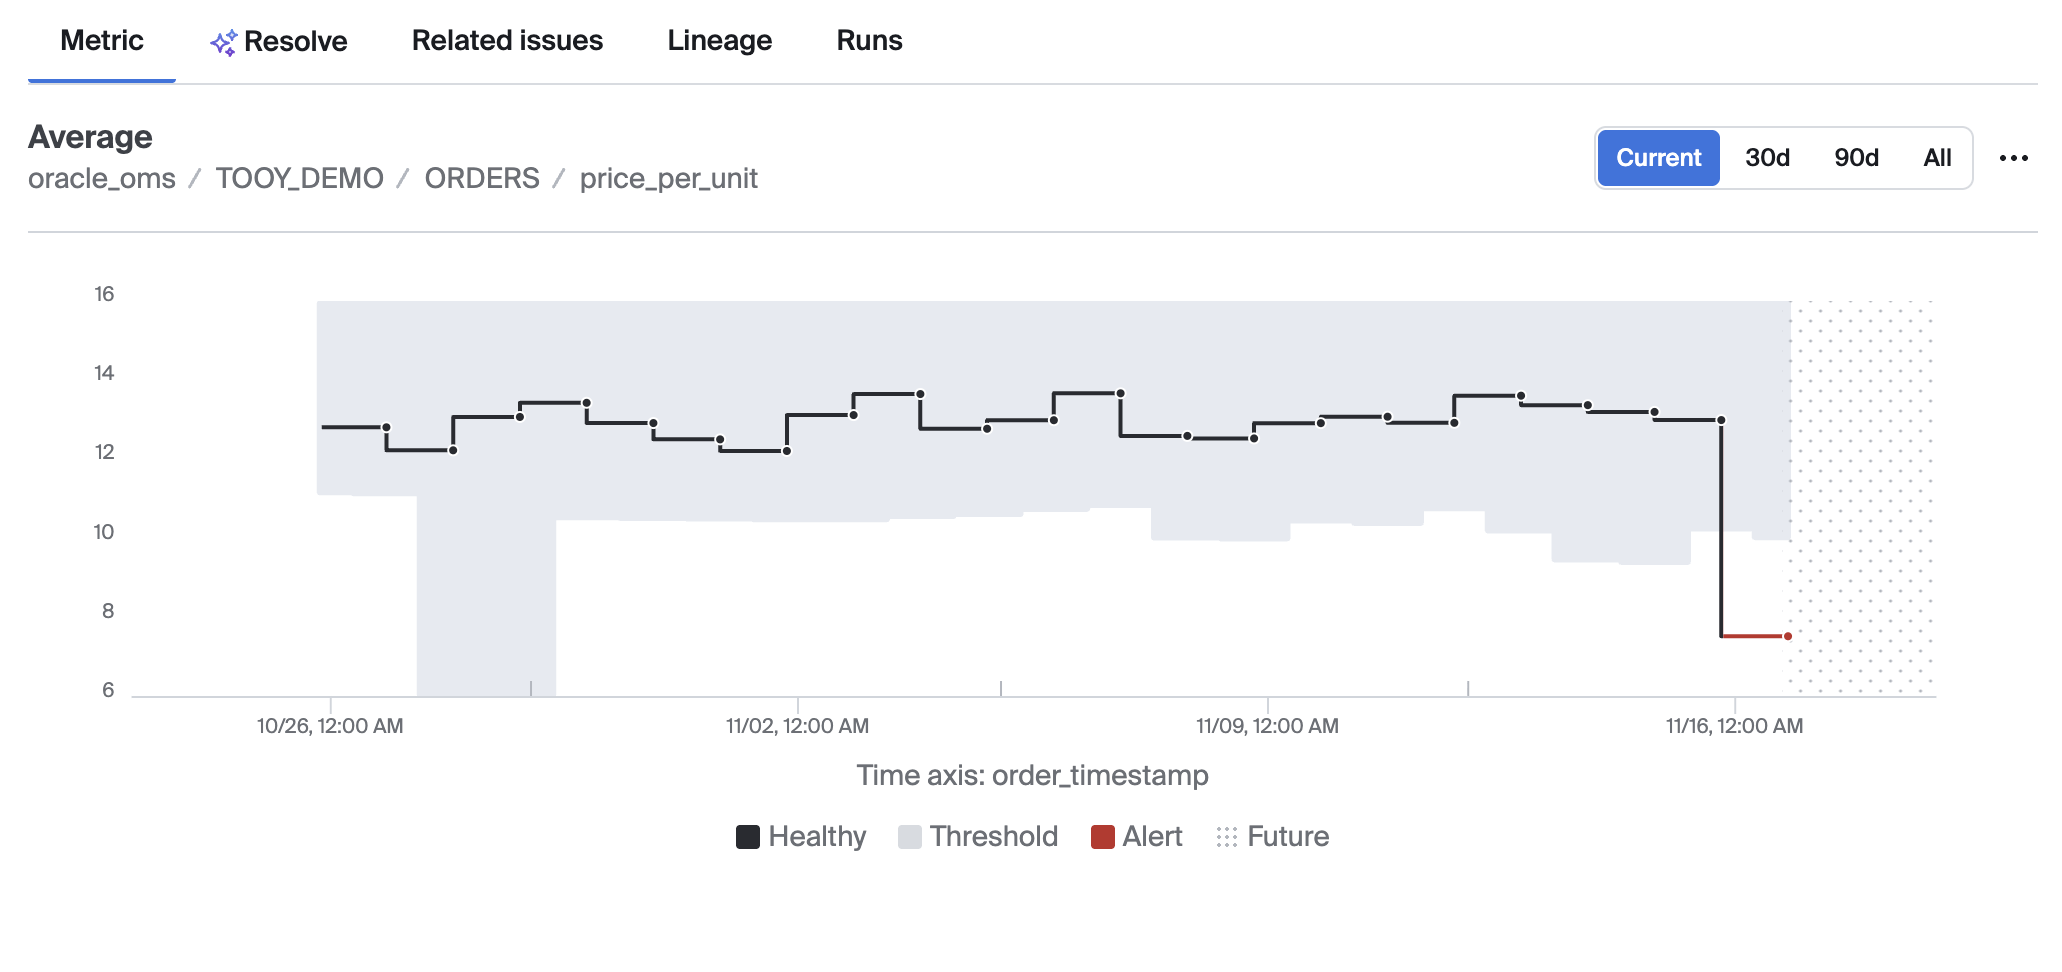
Metric tab
The metric tab's chart shows a time series visualization of the underlying alerting metric. You can view additional metric details such as the name of the metric, the configuration, and any suggestions on the root cause or impact that Bigeye can provide under the Overview tab in the right pane.
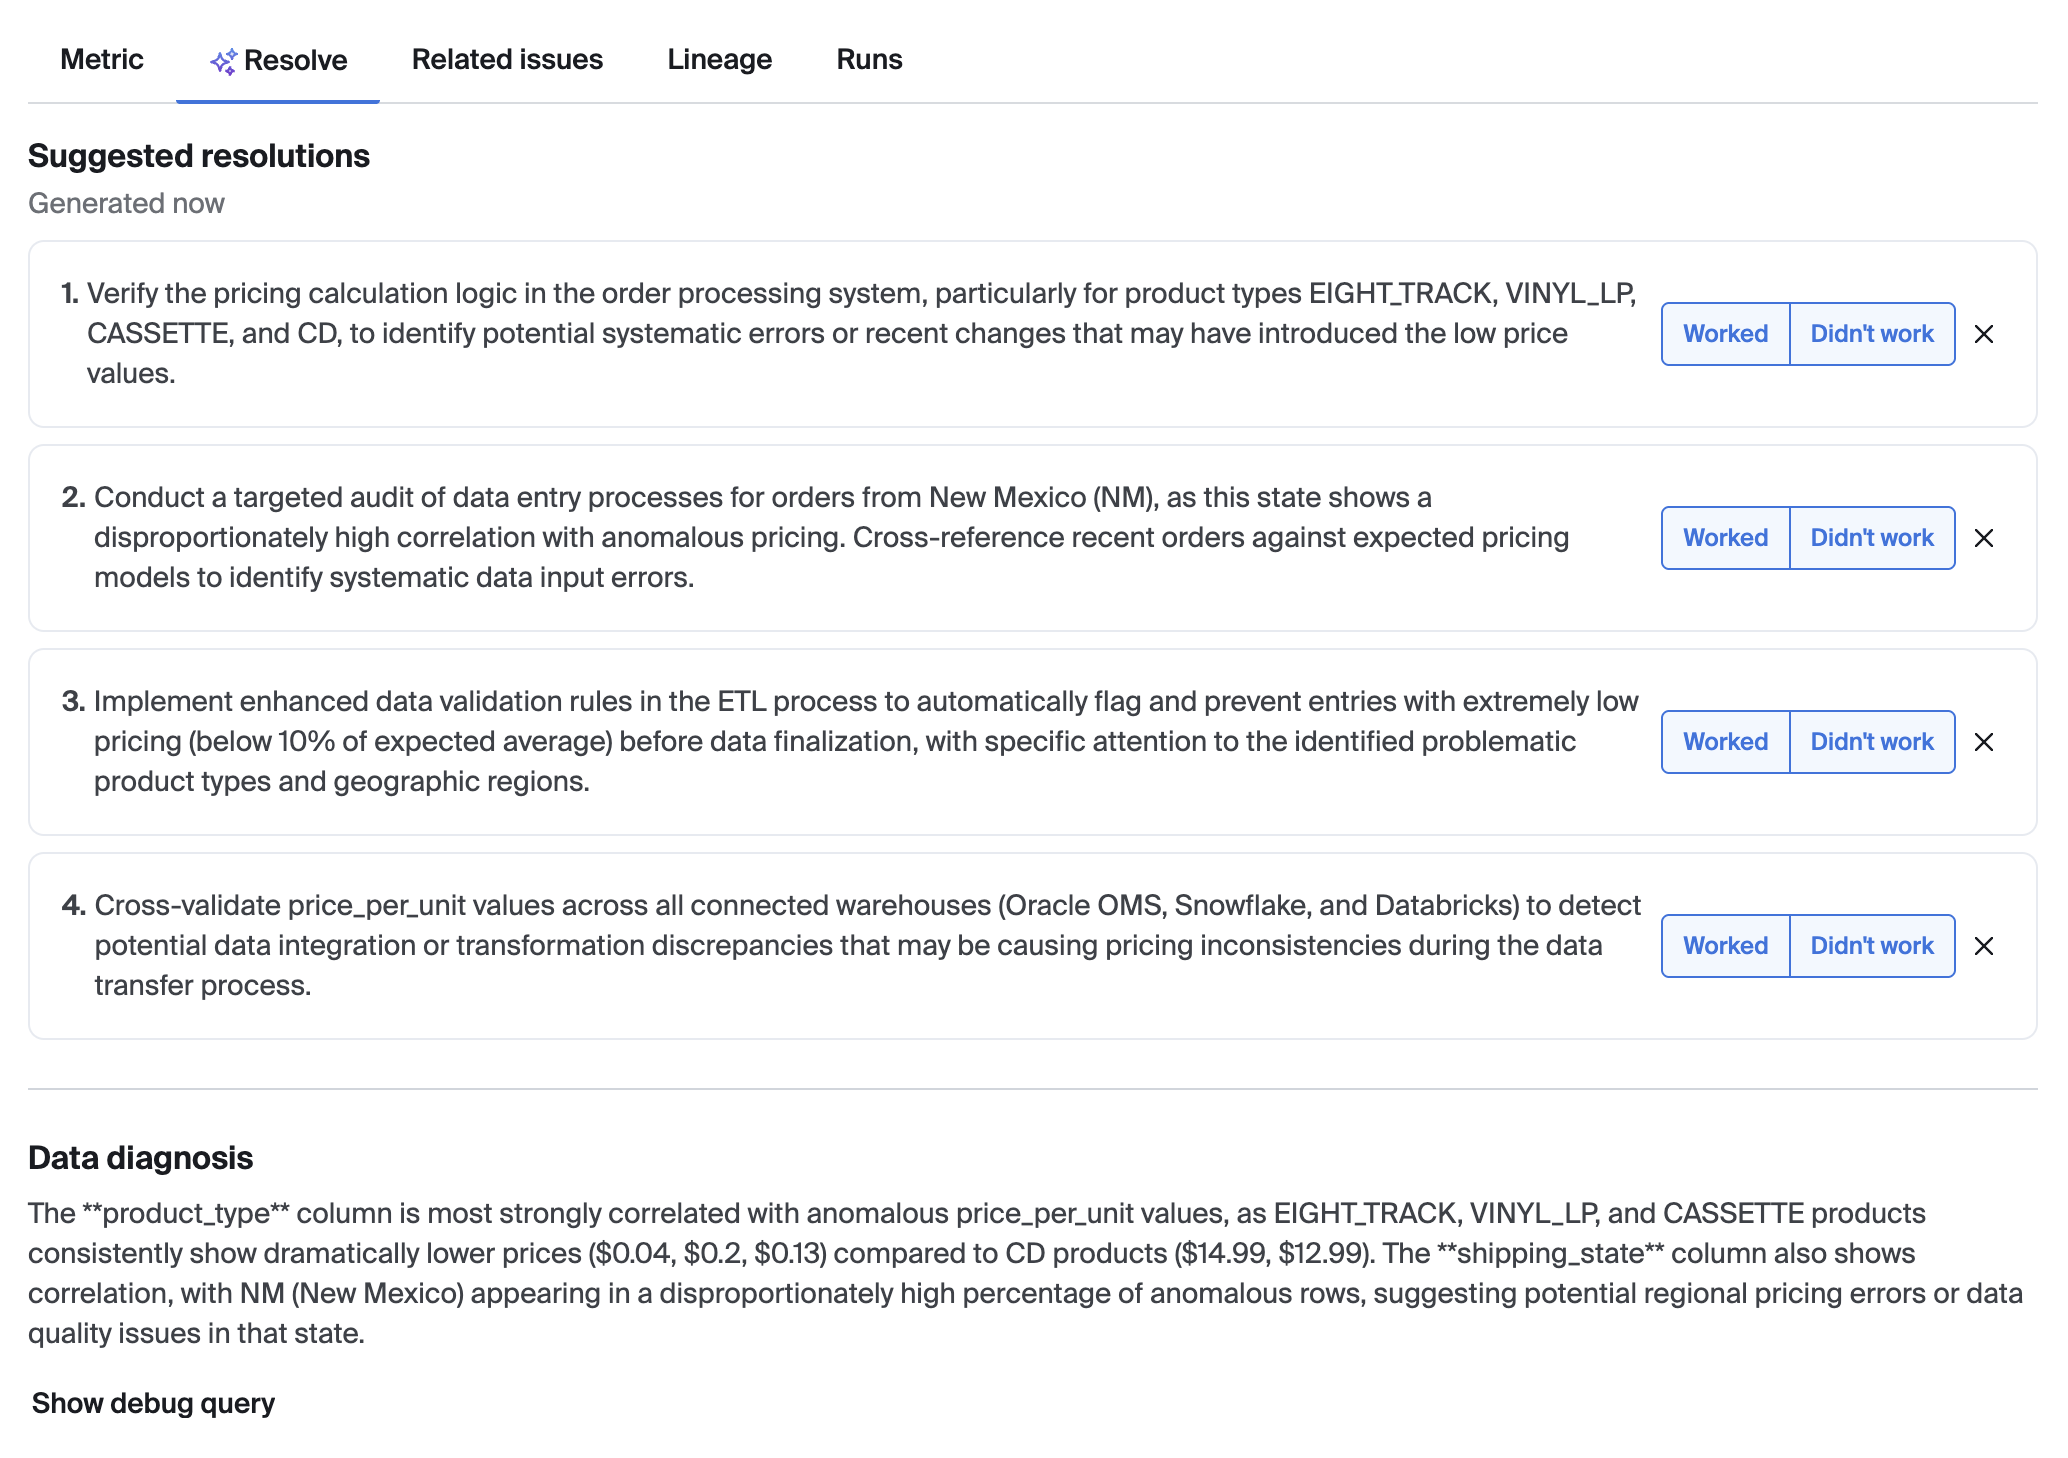
Resolve tab
The Resolve tab helps you identify resolution steps to fix the issue, as well as diagnostic information that can help explain why the issue is happening. Suggestions are generated using bigAI if it is enabled in your account.
Information on this tab includes:
- Suggested Resolutions - bigAI generated suggestions for fixing the issue based on a variety of available metadata, including your "Worked / Didn't Work" feedback on past suggestions.
- Data Diagnosis - bigAI analysis of the results of a query generated and run on the impacted table that looks only for relevant rows based on the type of anomaly detected.
- ETL Analysis - bigAI analysis of the code in the upstream ETL job(s) that generated the impacted table.
- Related Issues - bigAI analysis of past related issues, included any timeline comments, and resolution notes left when the issue was resolved.
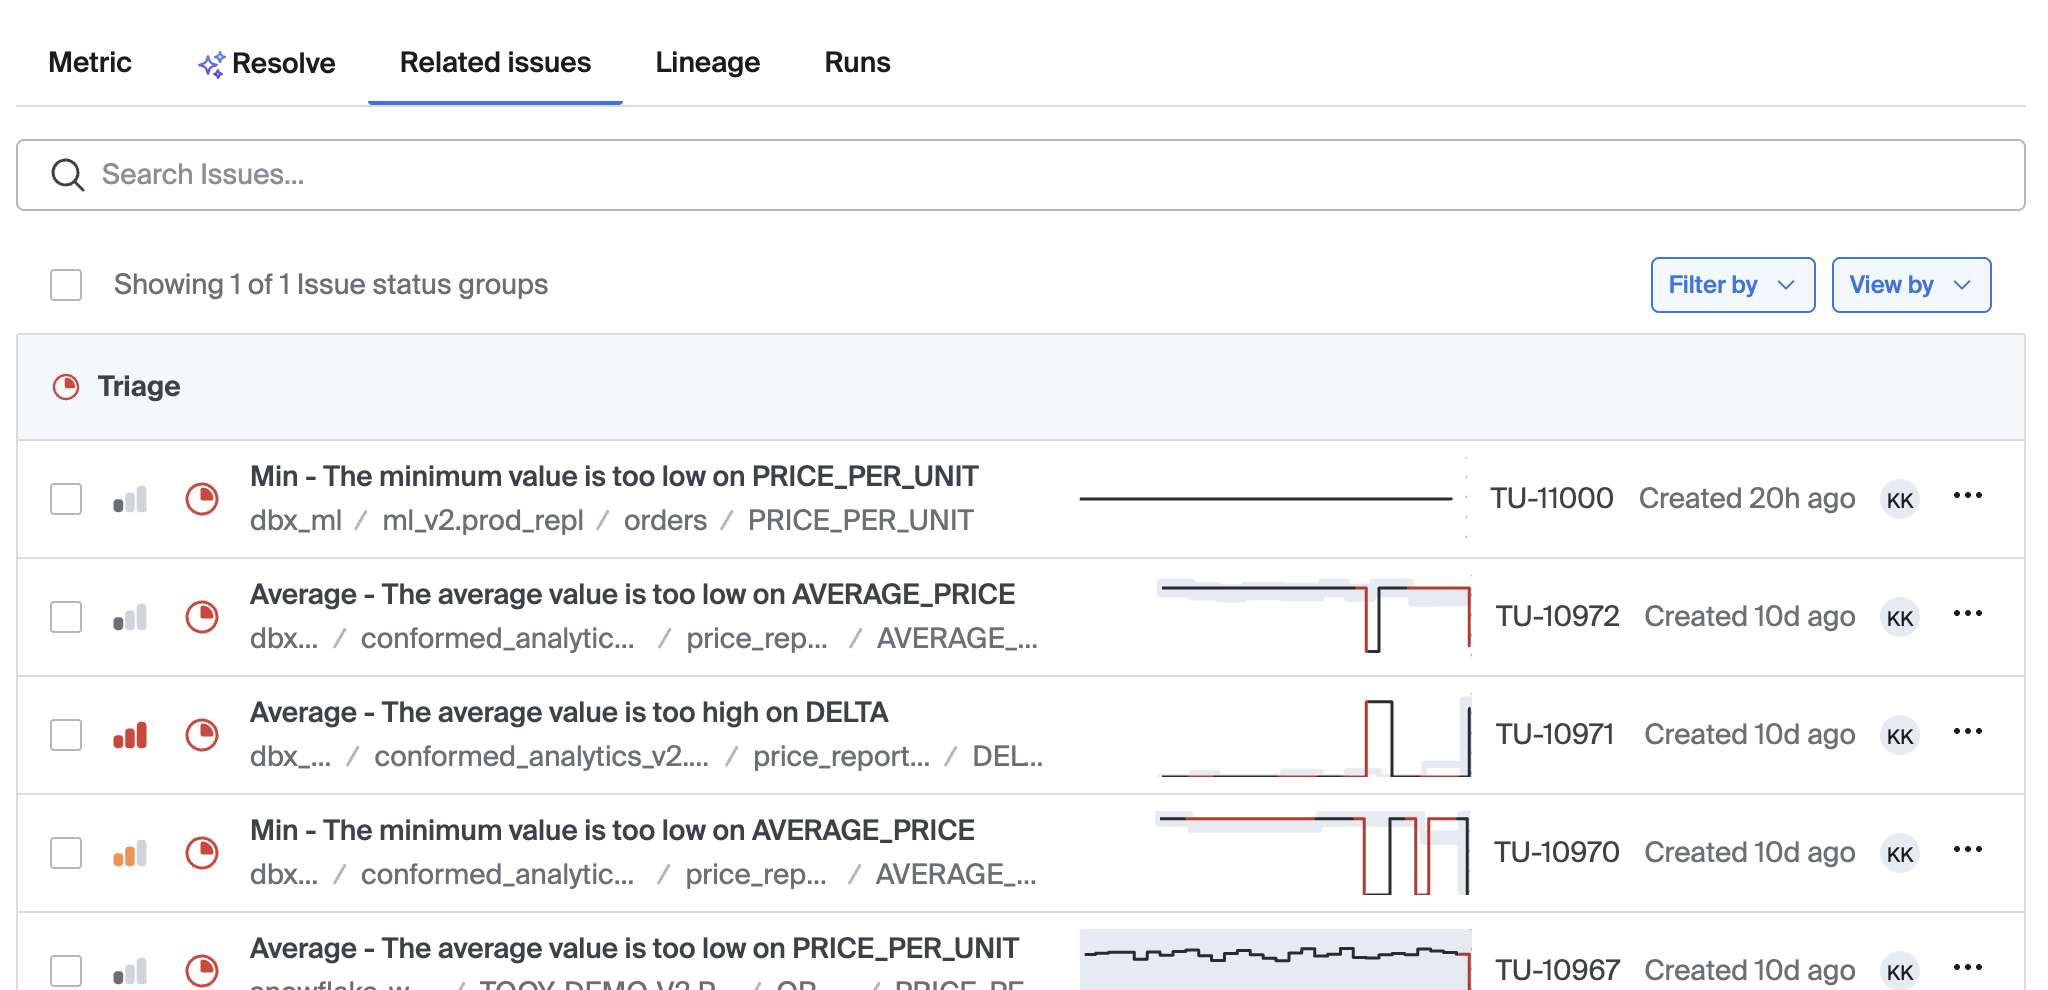
Related Issues tab
This tab shows a list of other issues related to the currently selected one. It may be helpful when identifying other issues to merge together into an Incident.
Lineage tab
The Lineage tab shows the data lineage of tables and columns upstream and downstream from the table/column impacted by the currently selected issue. It's easy to visually trace the downstream impact of the issue, or to follow an upstream trace to a potential root cause location.
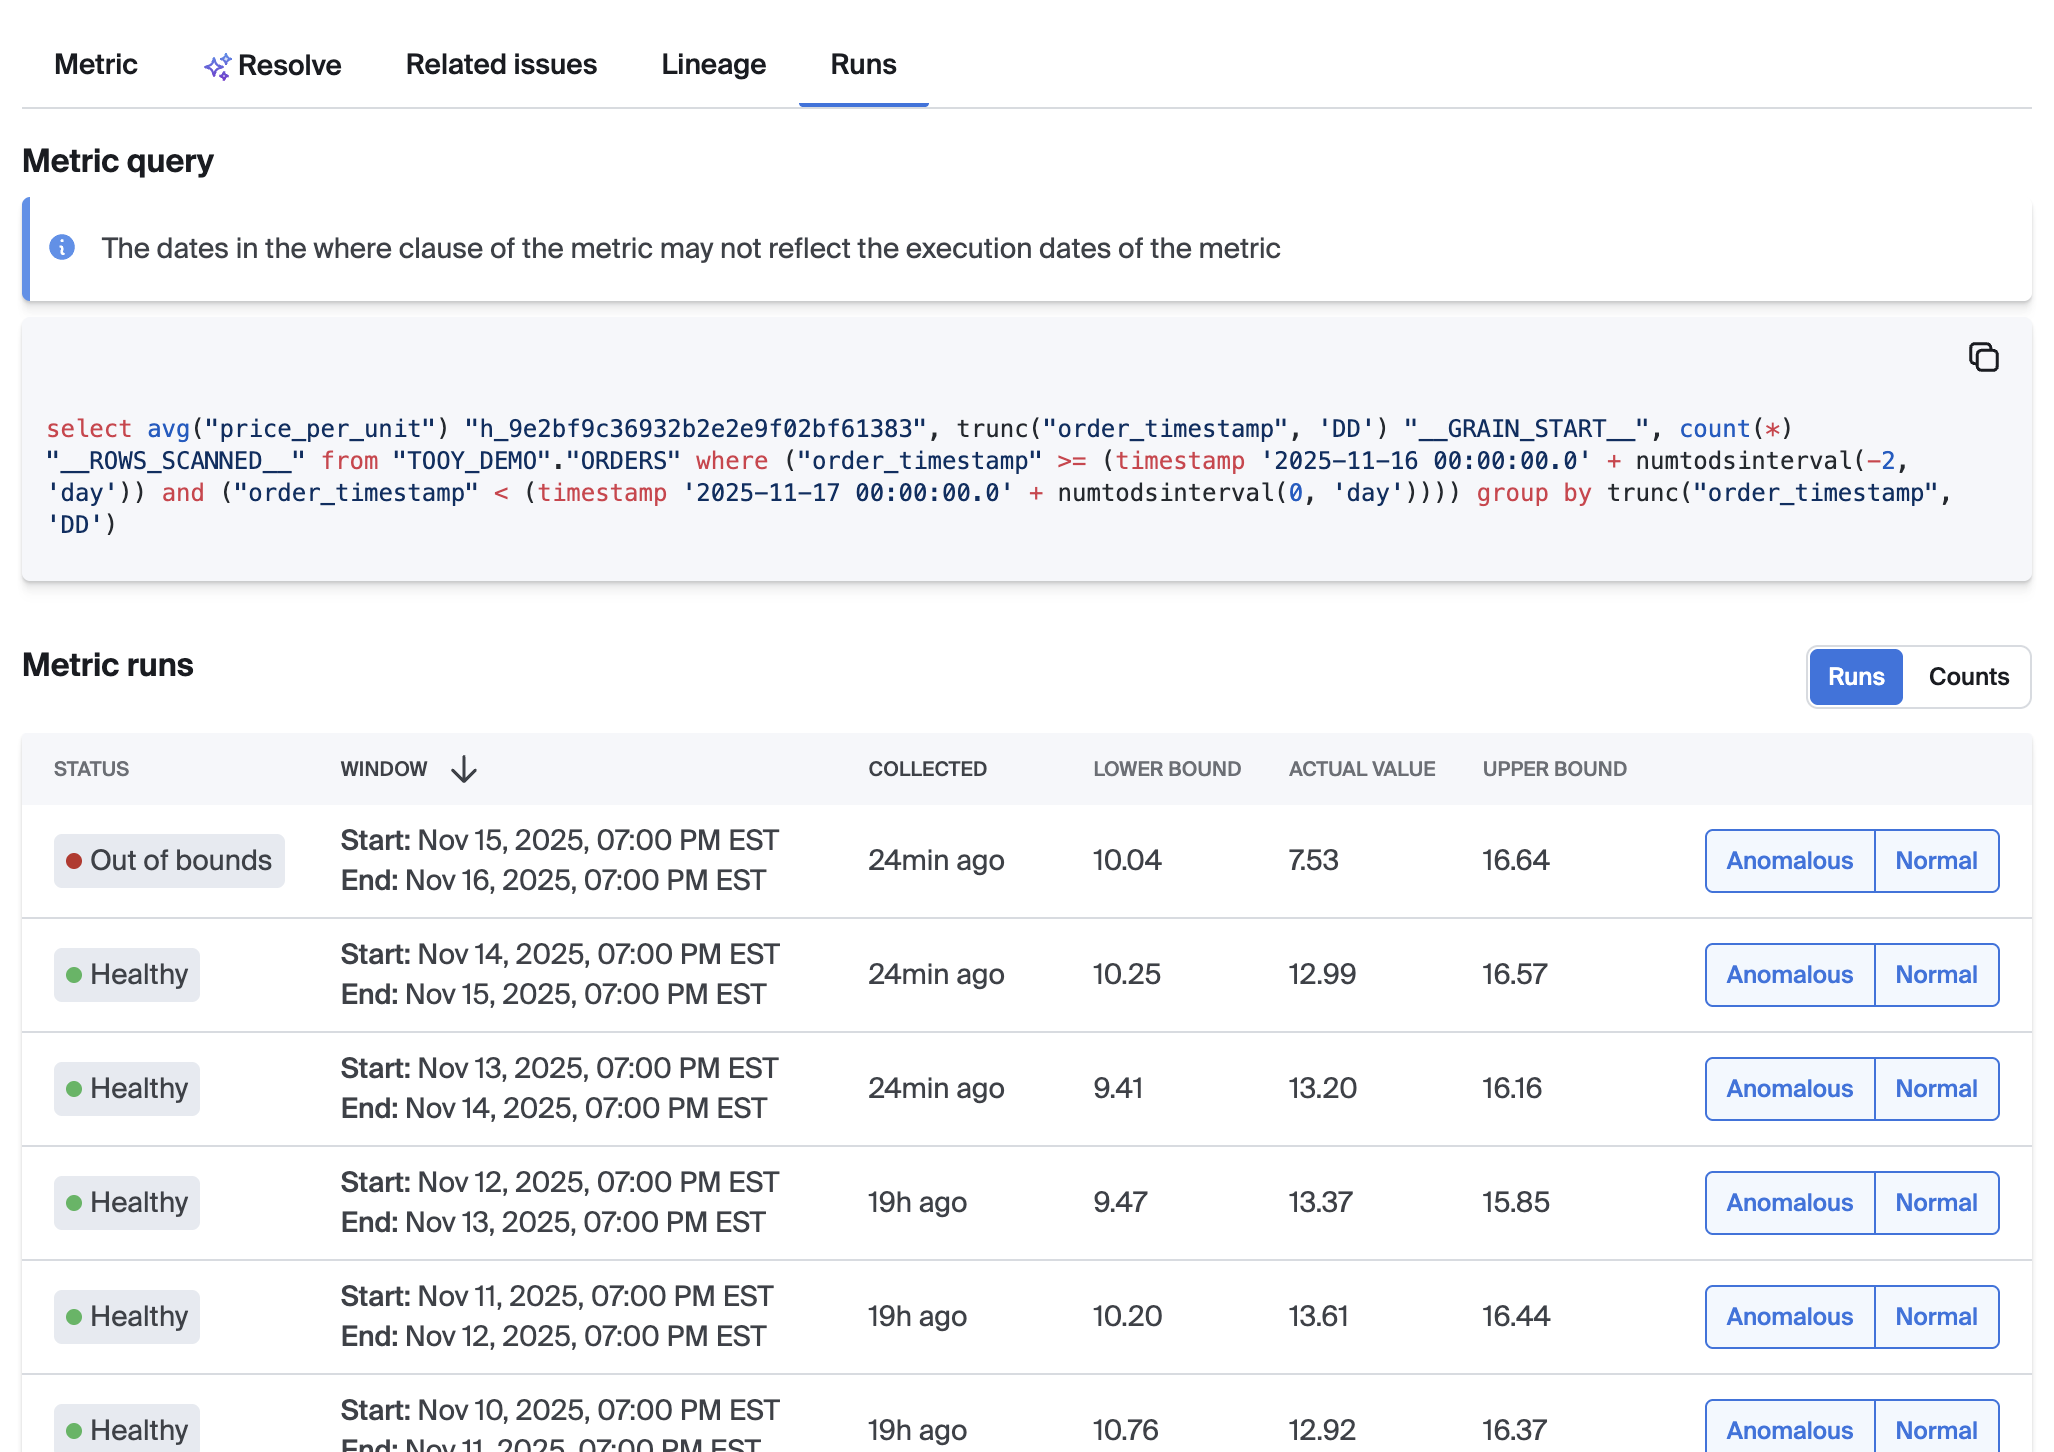
Runs tab
The Runs tab includes a list of each data point in the metric's time series, and the ability to adjust the annotation for each point that is used to train the Autothresholds model for the selected metric.
Updated 9 months ago