
Debug Query
Debugging can be challenging, especially when working with large-scale data. Often, a small change in data can lead to issues within records causing alerts to go off. Using Bigeye's Debug Query, you can analyze individual records within a data pipeline, quickly identify data issues, and optimize the troubleshooting process.
Since all Bigeye data quality metrics are computed using dynamic queries generated at runtime, Bigeye can dynamically generate a follow-up query to run when anomalies are detected. This follow-up query helps identify specific rows that contribute to an anomaly and shows a preview of the affected rows to speed up root cause analysis.
Using debug query, you can
- See impacted data right in your workflow
- Export debugging queries for further analysis
Supported metrics
Debug Query is available for the following metrics:
Debug queries are only available for alerting metrics.
How to troubleshoot issues using Debug Query?
There are two ways in which you can use the debug query:
- Run the debug query in your data source
- Preview the debug query
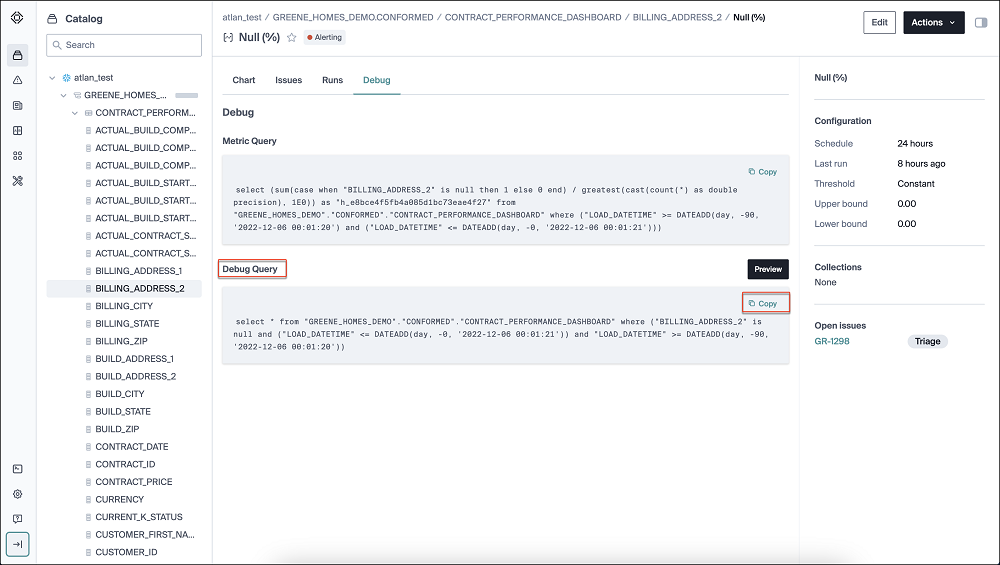
Run the debug query in your data source
If users need to view all records related to the query, running the debug query in the data source is recommended. To do so, click the debug tab on the metric page, copy the debug query, and run it in your data source.
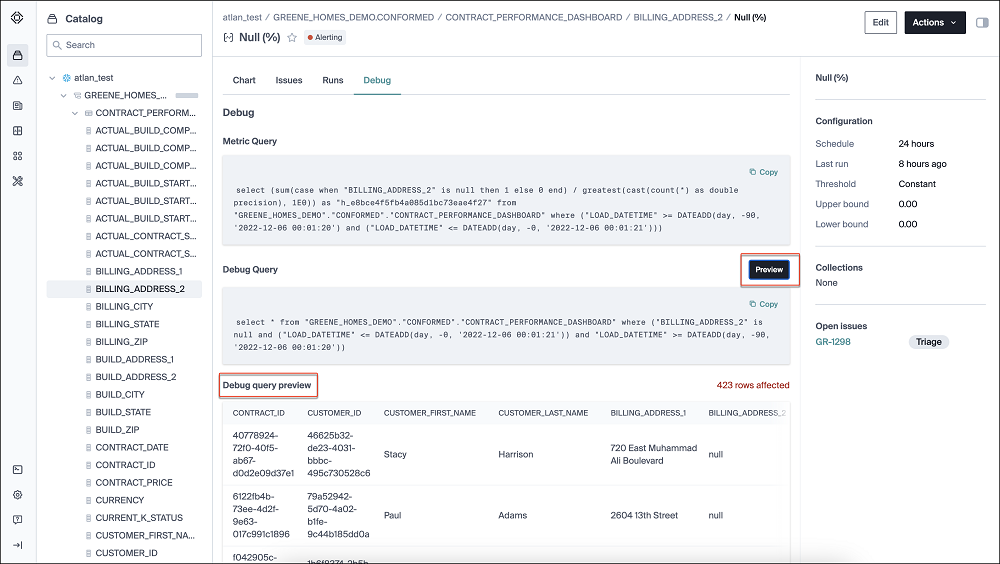
Preview the debug query
Alternatively, use the preview button to view a list of sample records affected by the issue. You can also view additional information when you use the preview feature, such as the total number of records returned by this query.
Bigeye doesn't store the data preview anywhere.
Updated 9 months ago