
View Delta Results
In the Deltas list, the summary of each Delta's most recent run is provided. You will see the name, the number of metrics alerting or passing, and the last run time.
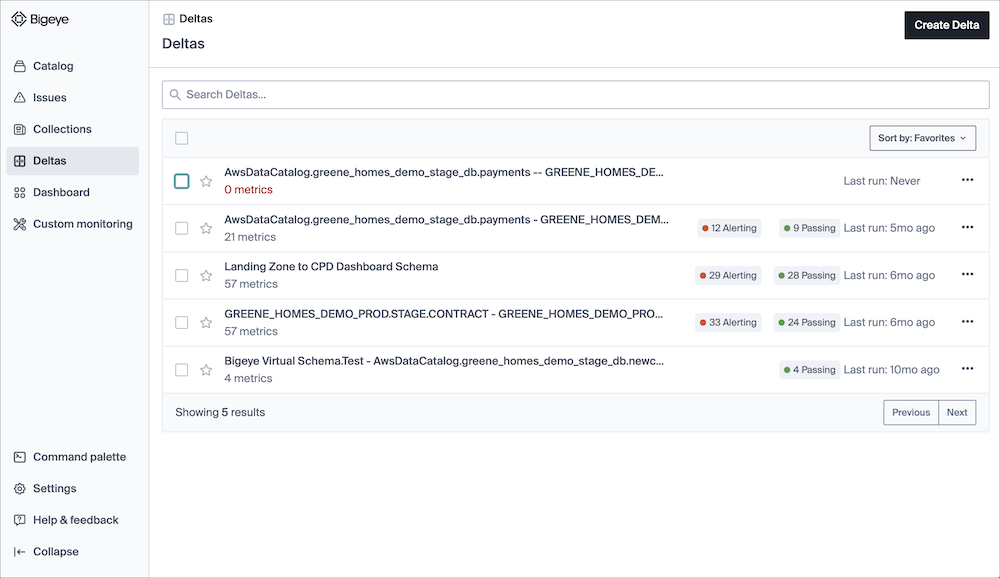
Click the name of a Delta to see the details of the most recent run. This list shows each source and target pair, the count of metrics run over the delta, and the count of passing and alerting metrics.
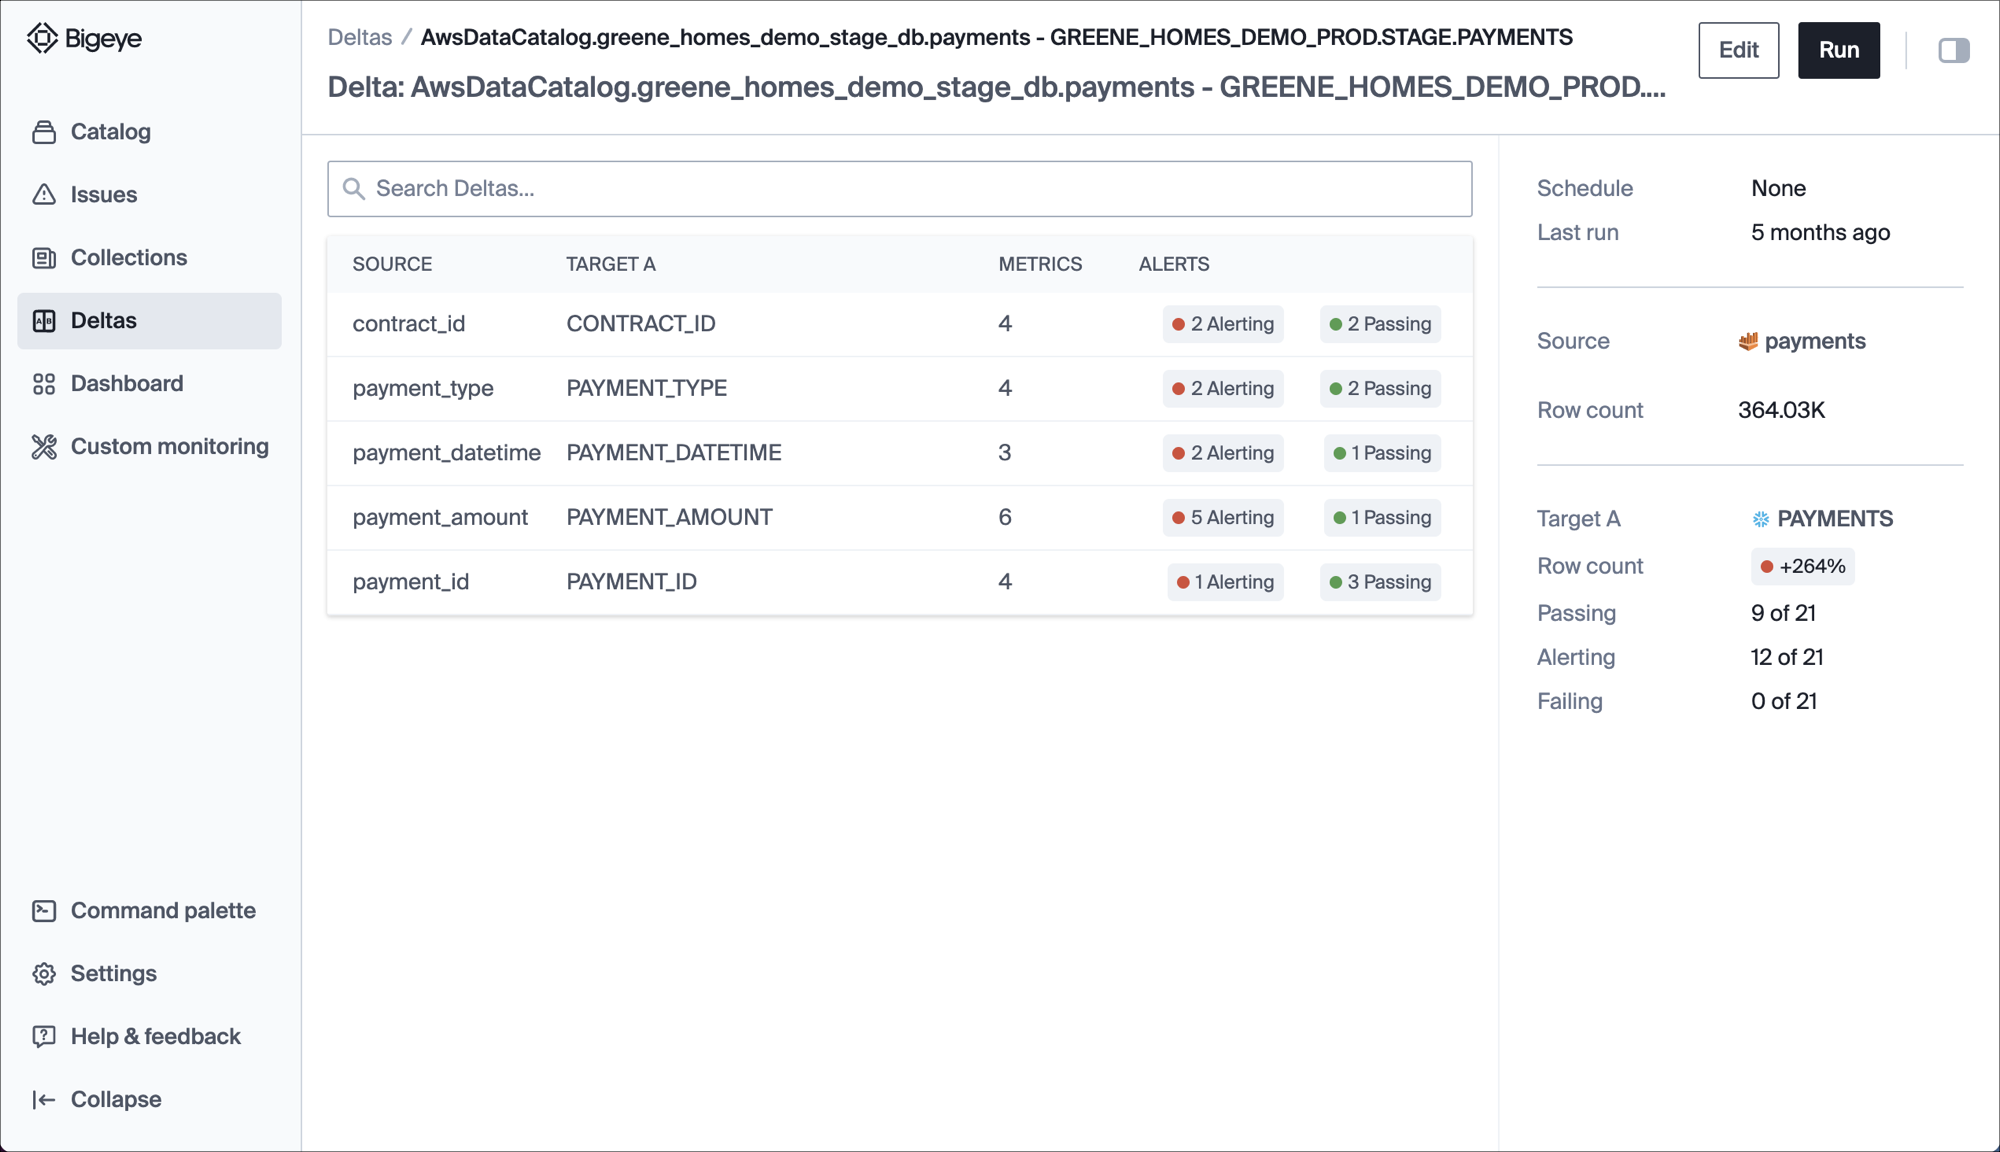
In the right pane, you see:
| Name | Definition |
|---|---|
| Schedule | The cadence of delta query. |
| Last run | The time of Delta's last run. The tooltip shows the exact time and if another run is scheduled. |
| Source | The source table for data comparison. |
| Row Count | The % match of row count from each table; a tooltip shows the exact counts. |
| Target A or B | The target table for data comparison. |
| Passing | The # of column pairs where the metrics match. |
| Alerting | The # of column pairs where the metrics do not match |
| Failing | the # of column pairs with an error (database, network, etc.) |
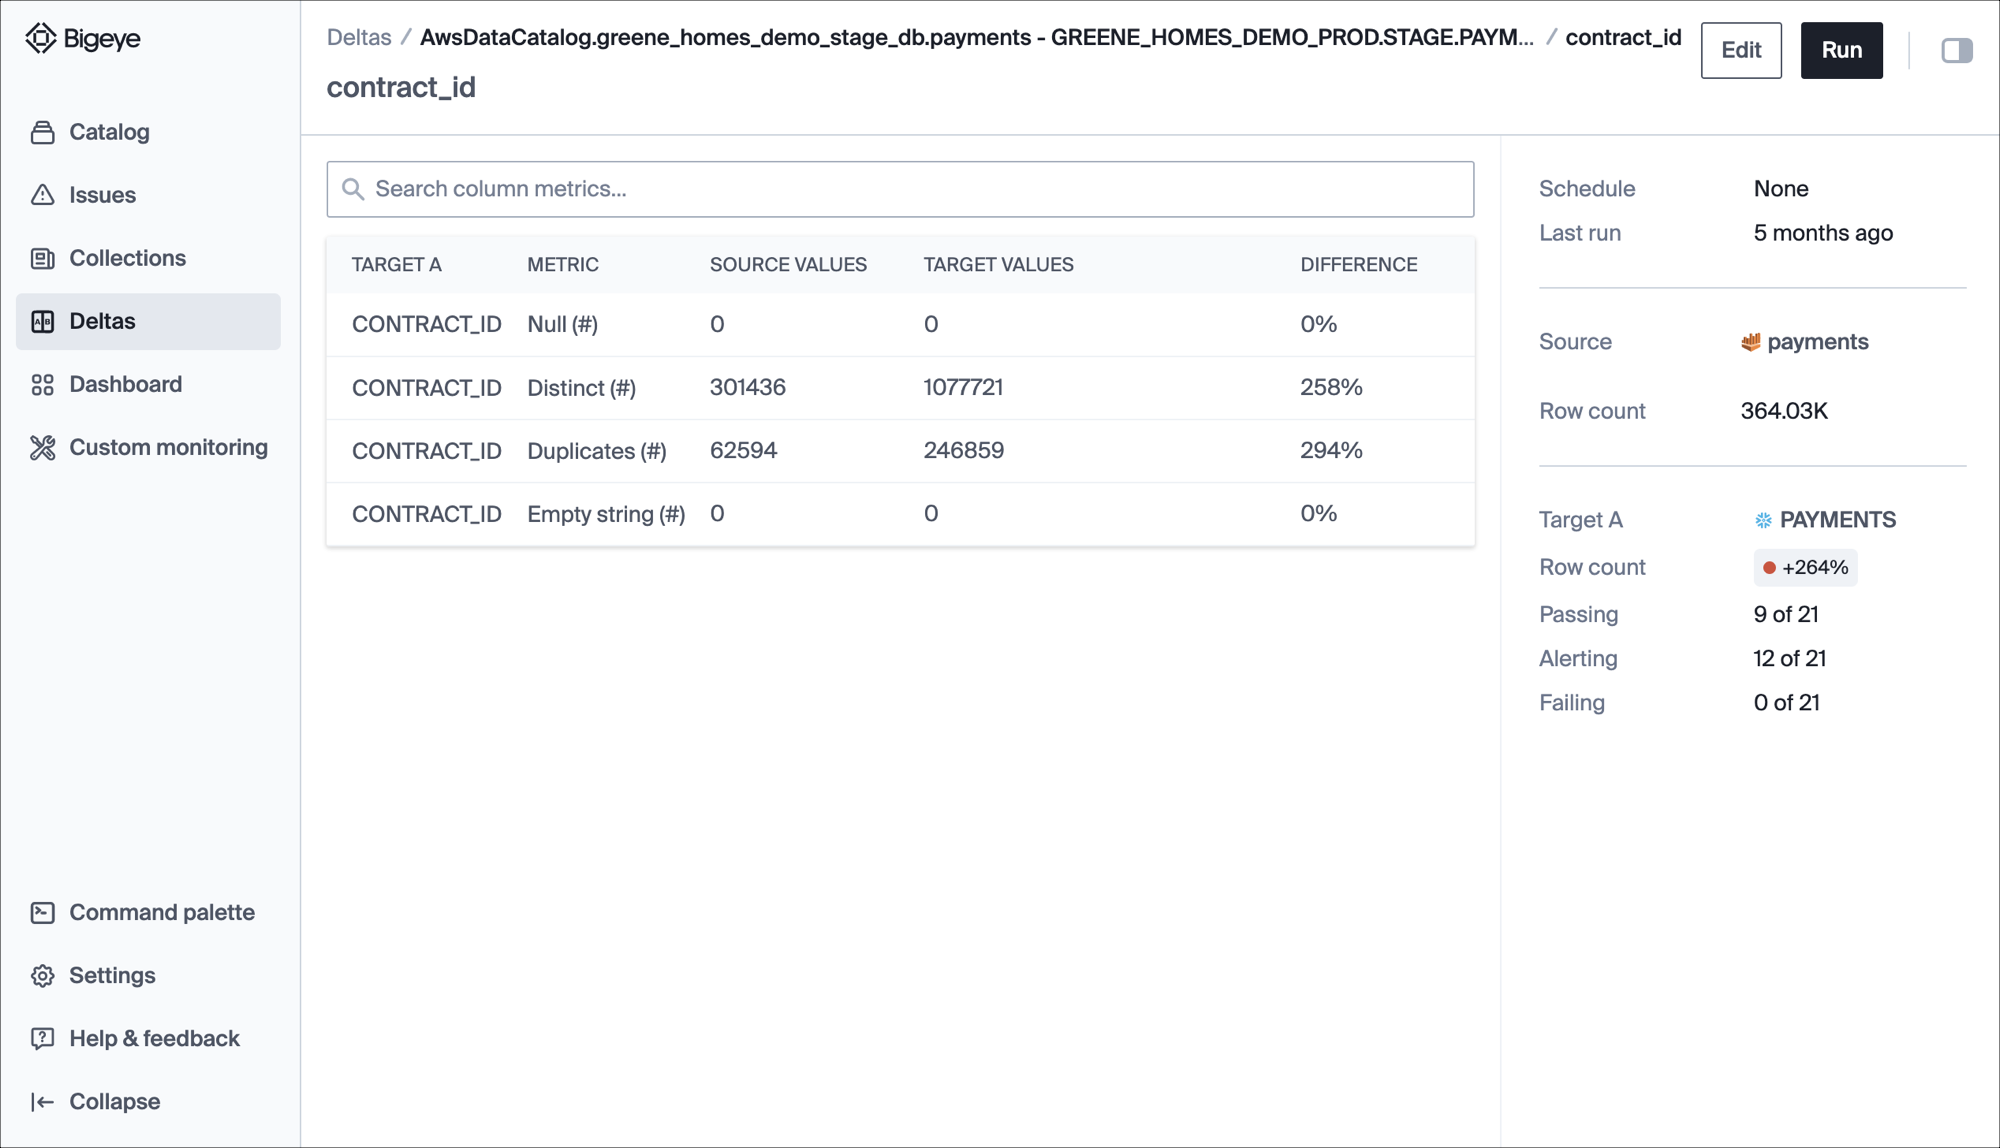
Clicking a column name takes you to the Column Metric Details for the target table.
This list shows the details of alerting and passing metrics for a column pair, the metric value from each column, and the difference. If there is a difference, there is an alert.
Three-way data comparison
When you create a three-way delta, you see a toggle button to switch between your two target columns. This three-way delta comparison in a single view enables you to compare a single target table to the other two target tables in a pairwise way.
Updated 9 months ago