Monitor Dashboard Health
Let’s say you have a dashboard to monitor your e-commerce website that depends on a corresponding table with 5 different metrics configured: freshness of placed orders, null %, average unit price, number of gift card purchases, and a count of the orders.
You want to get an alert if any of the metrics run into any issues. In this tutorial, we will show you how to use Bigeye to monitor your dashboard's health.
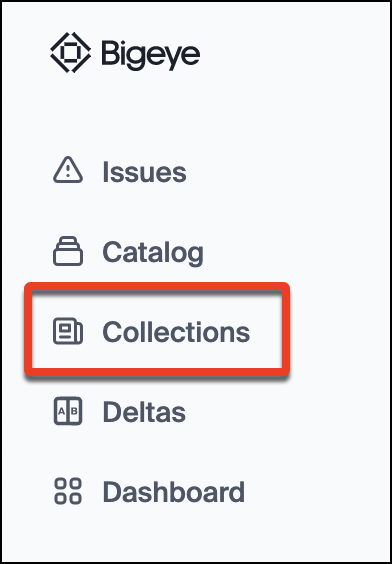
- Login to your Bigeye account and on the side menu click the Collections tab
A Collection in Bigeye is a grouping of metrics that will send you an alert if any of the metrics go out of bounds.
- Click Create collection and give your collection a name.
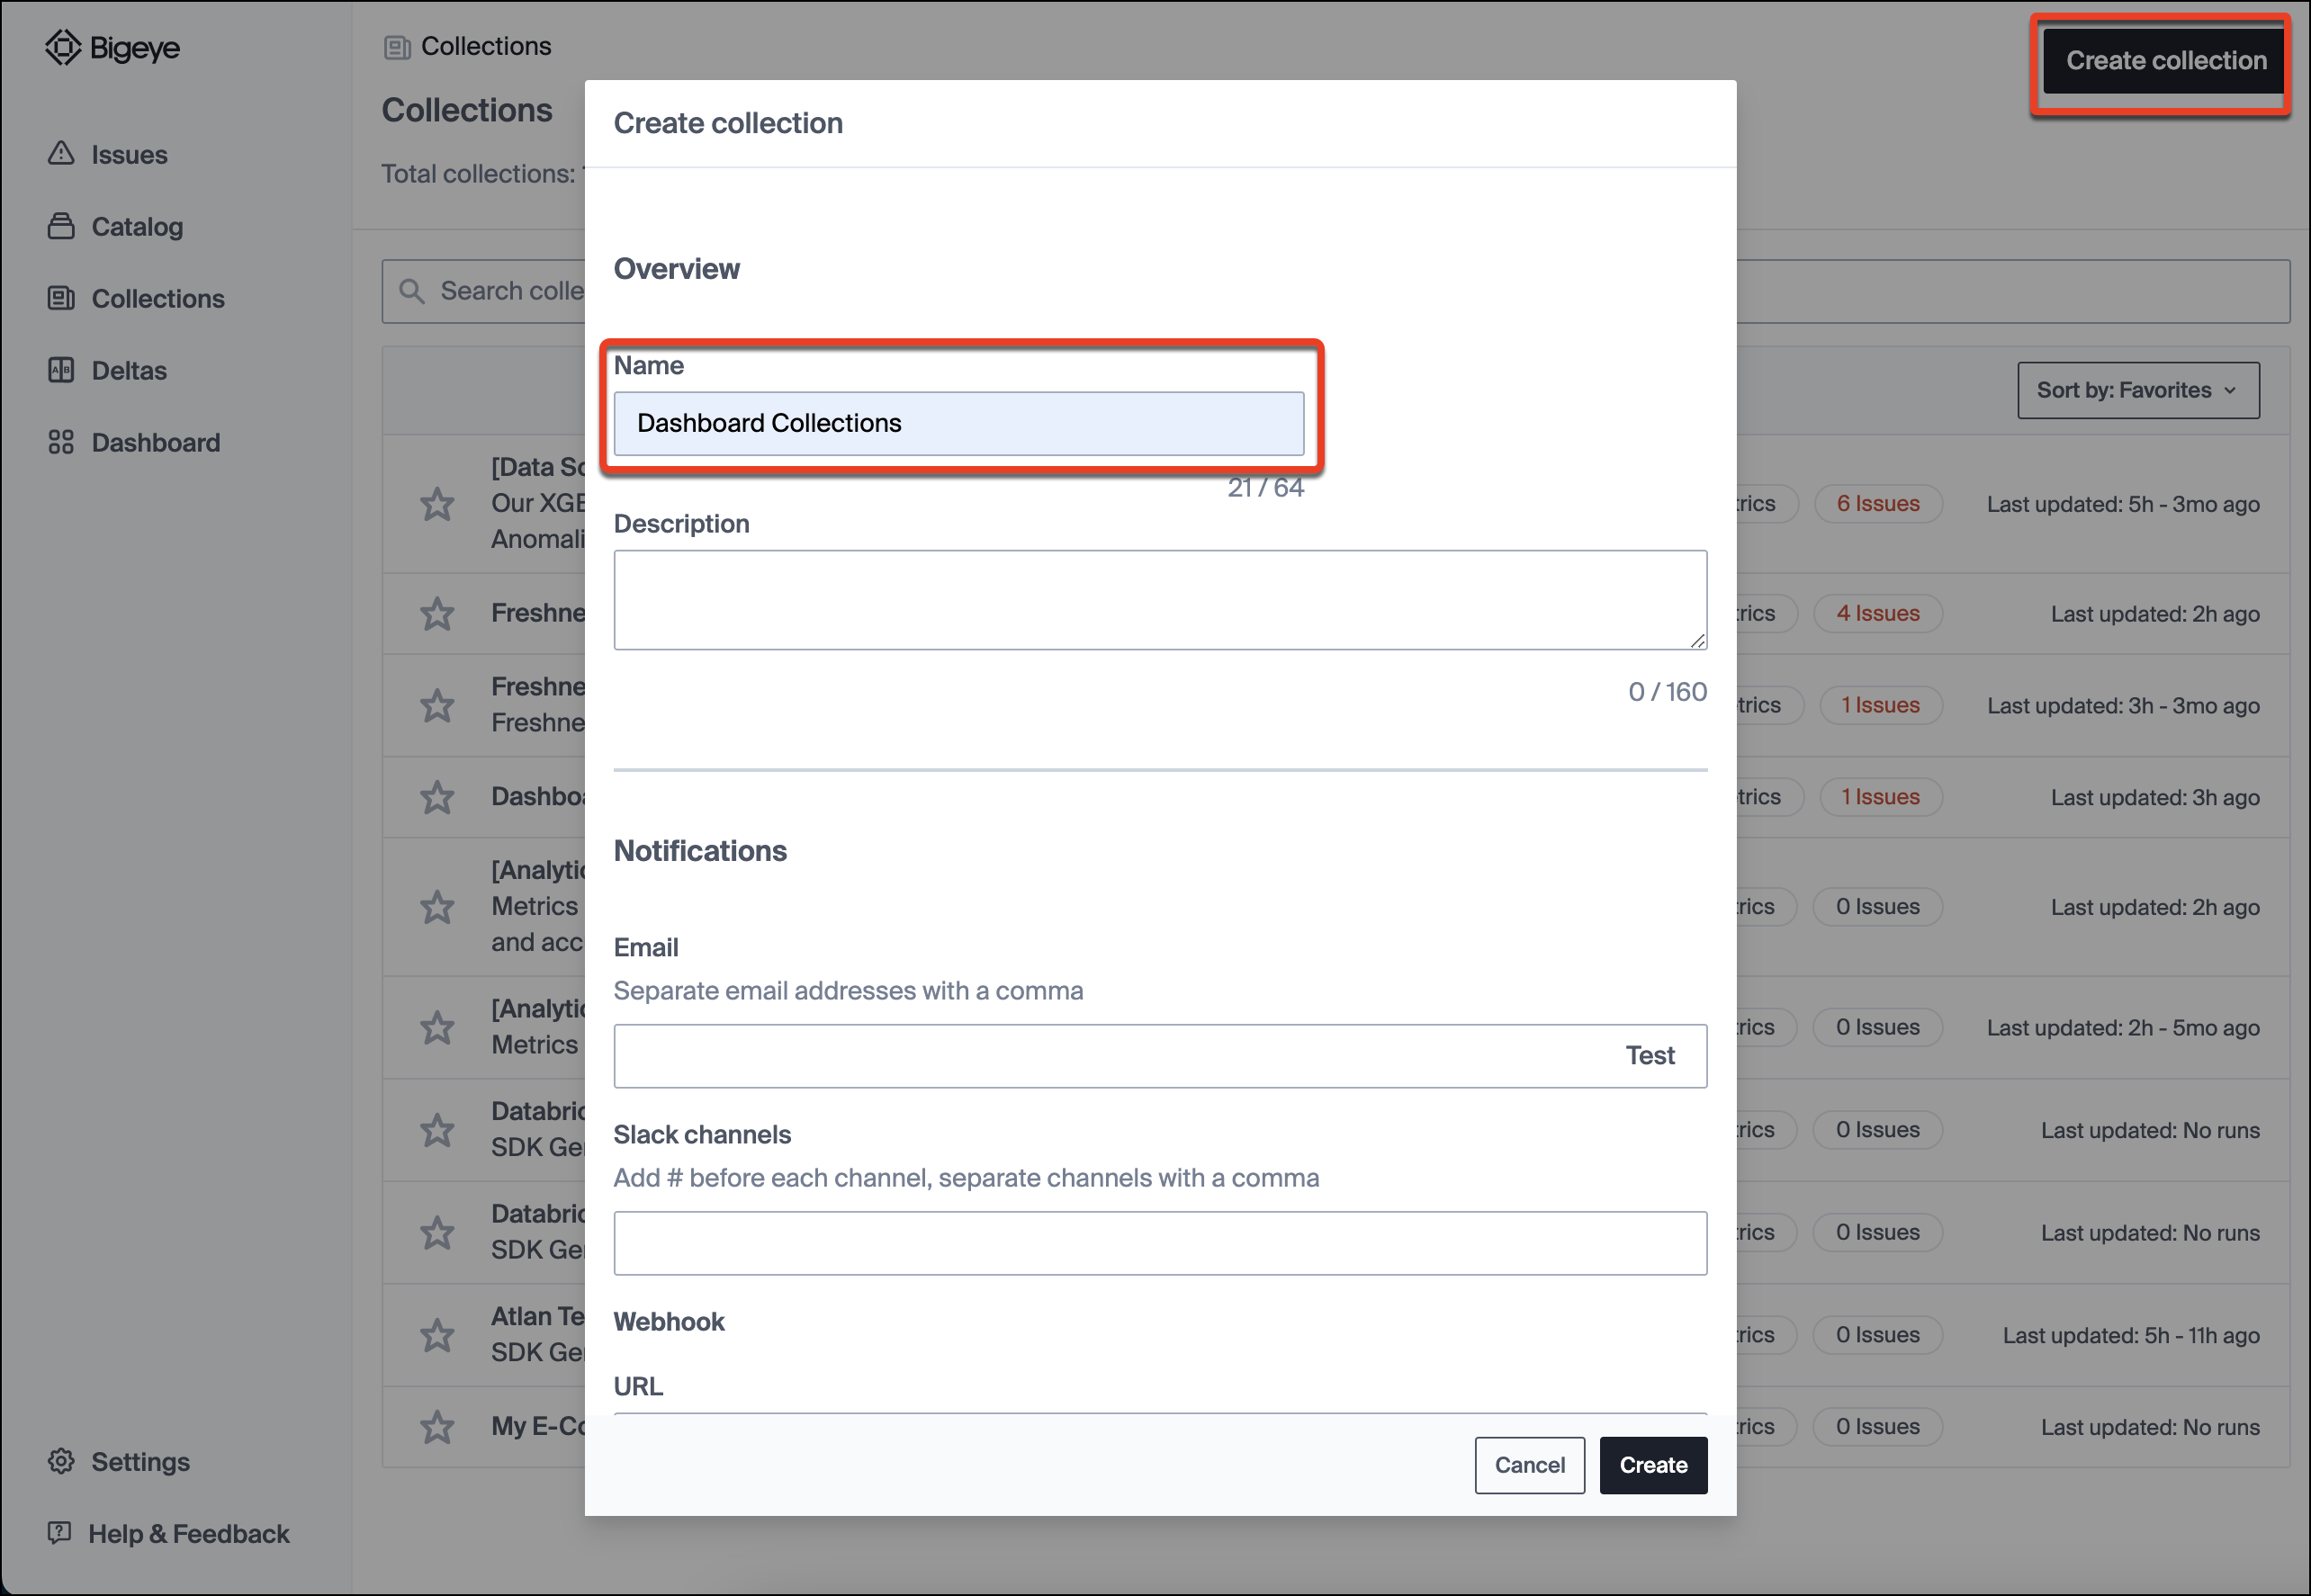
You also have the option to add email and slack notifications, or webhooks to the Collection.
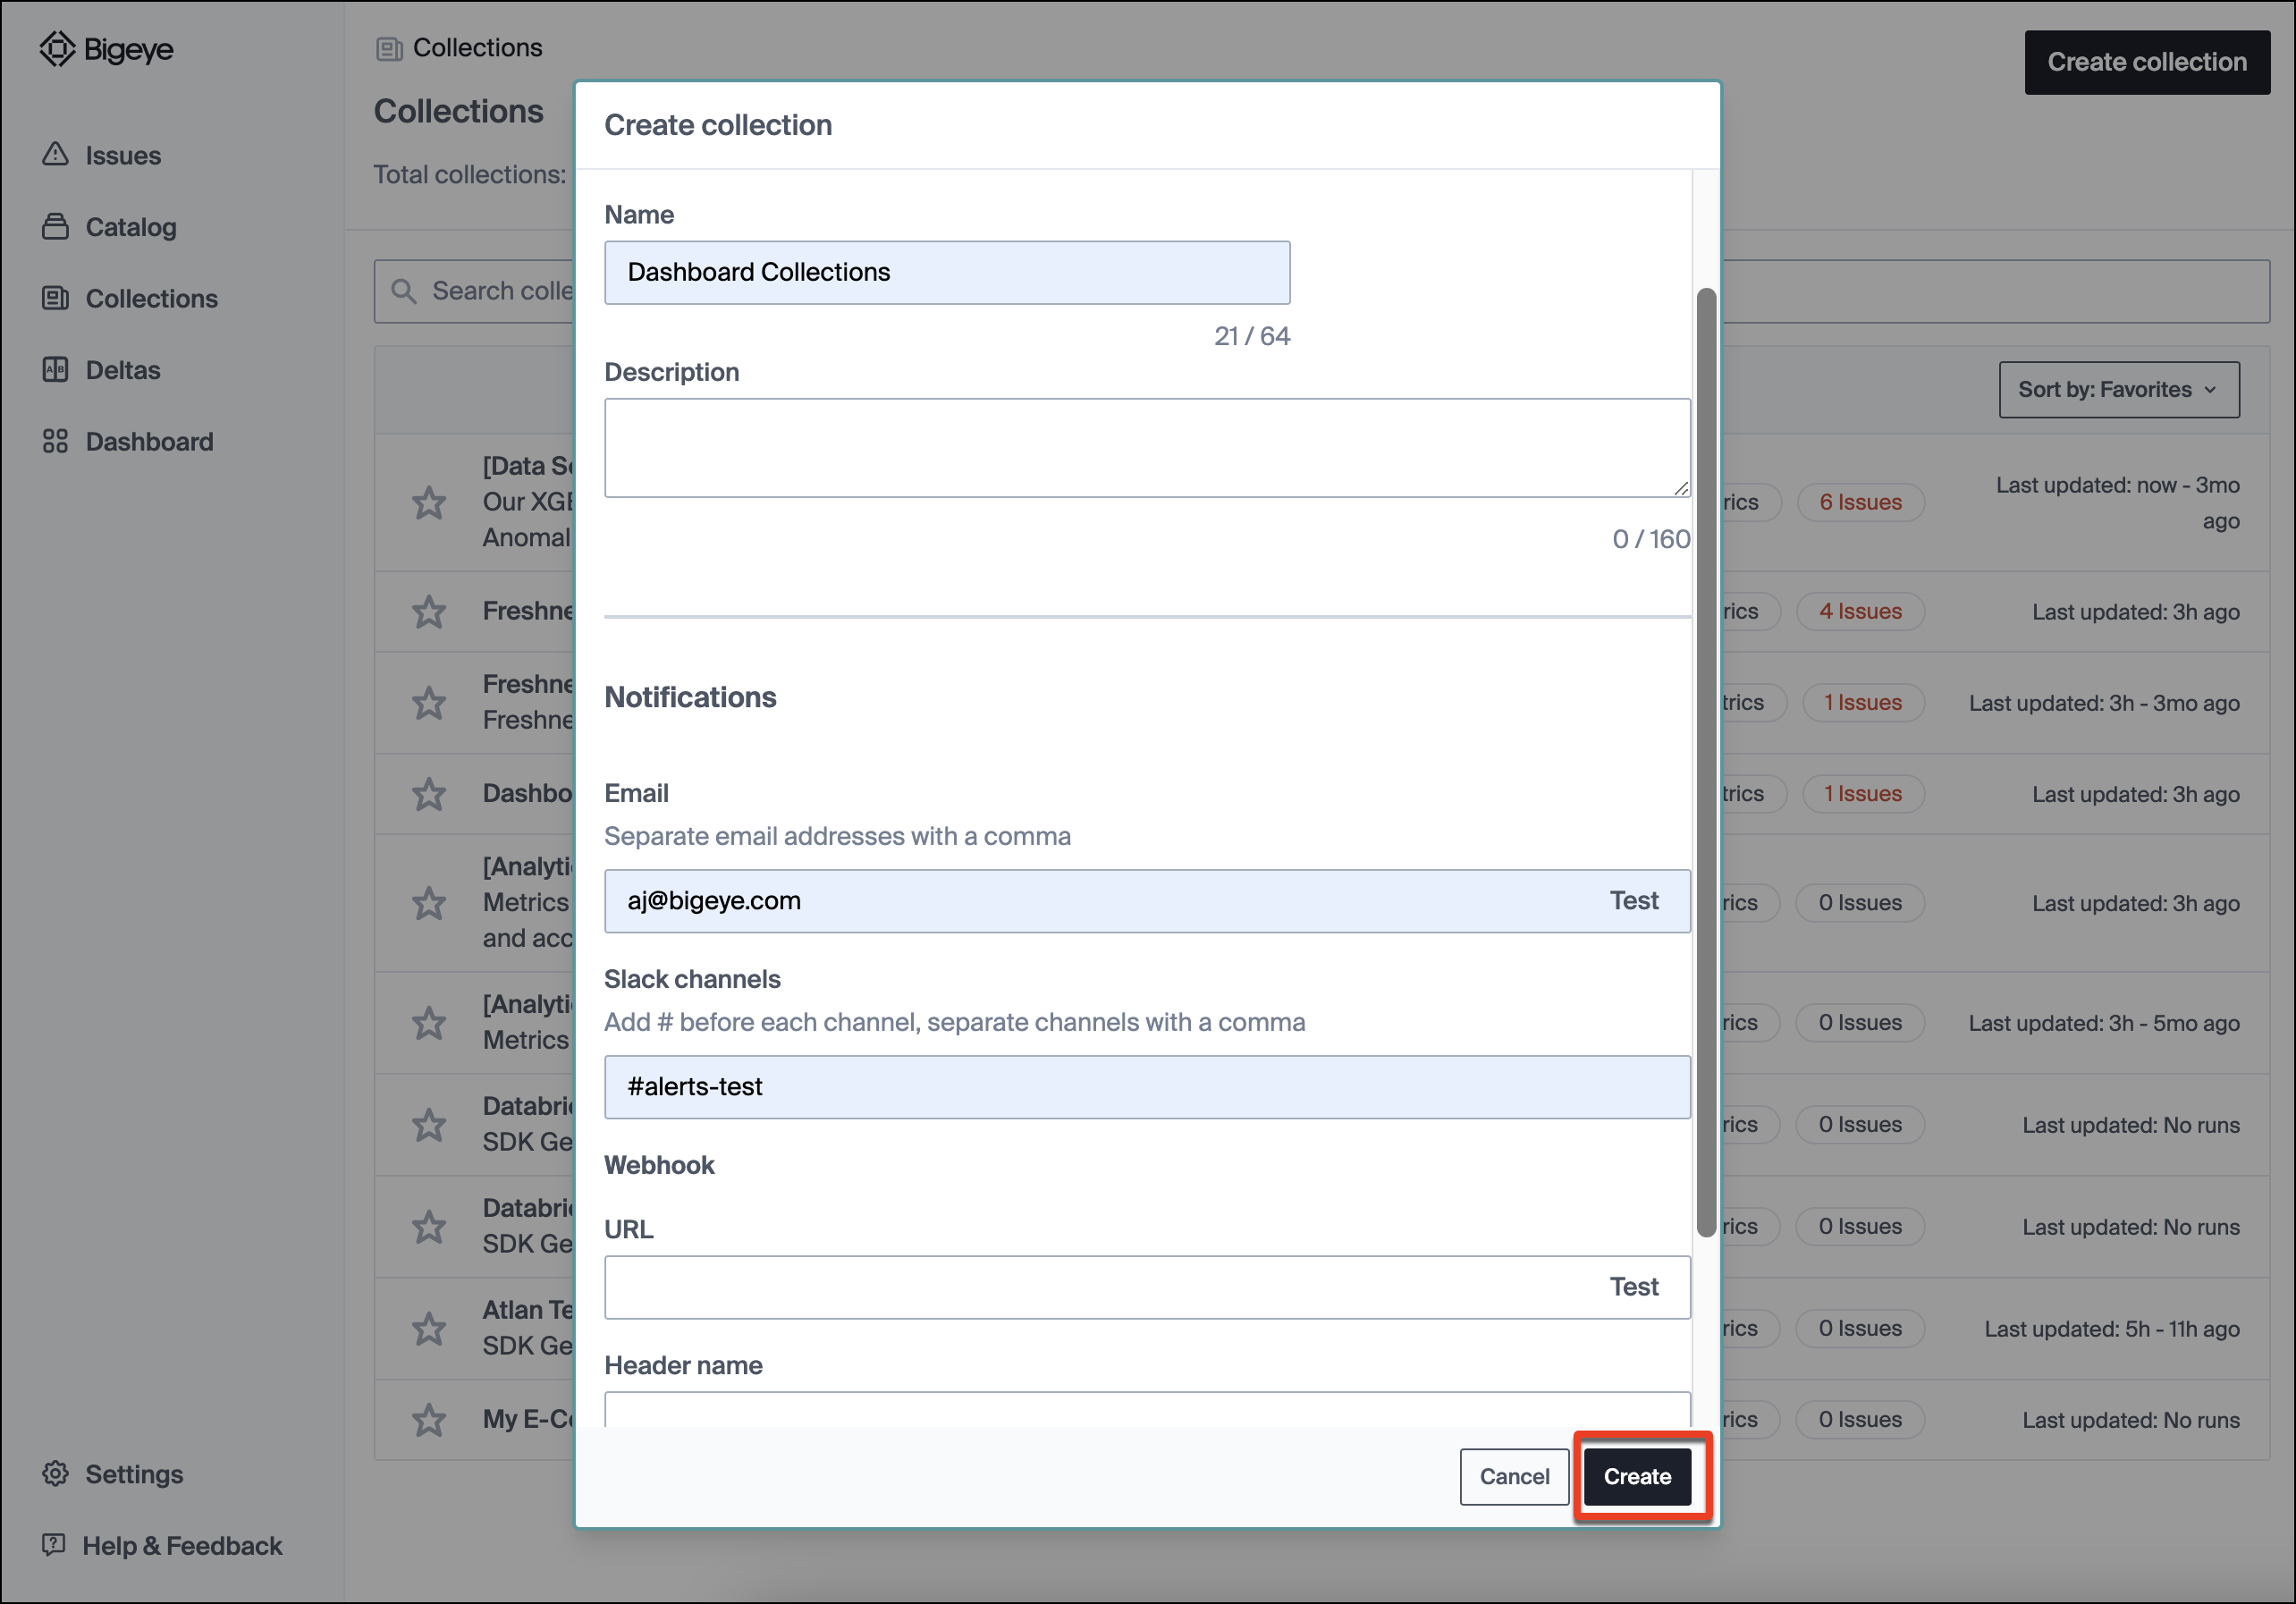
Once done, click Create.
- Add metrics to the Collection
We can add metrics to a collection from the Metrics pages. From the Collections page, you can navigate to metrics by clicking on the Catalog tab, then on the relevant schema/table, and then the metrics tab.
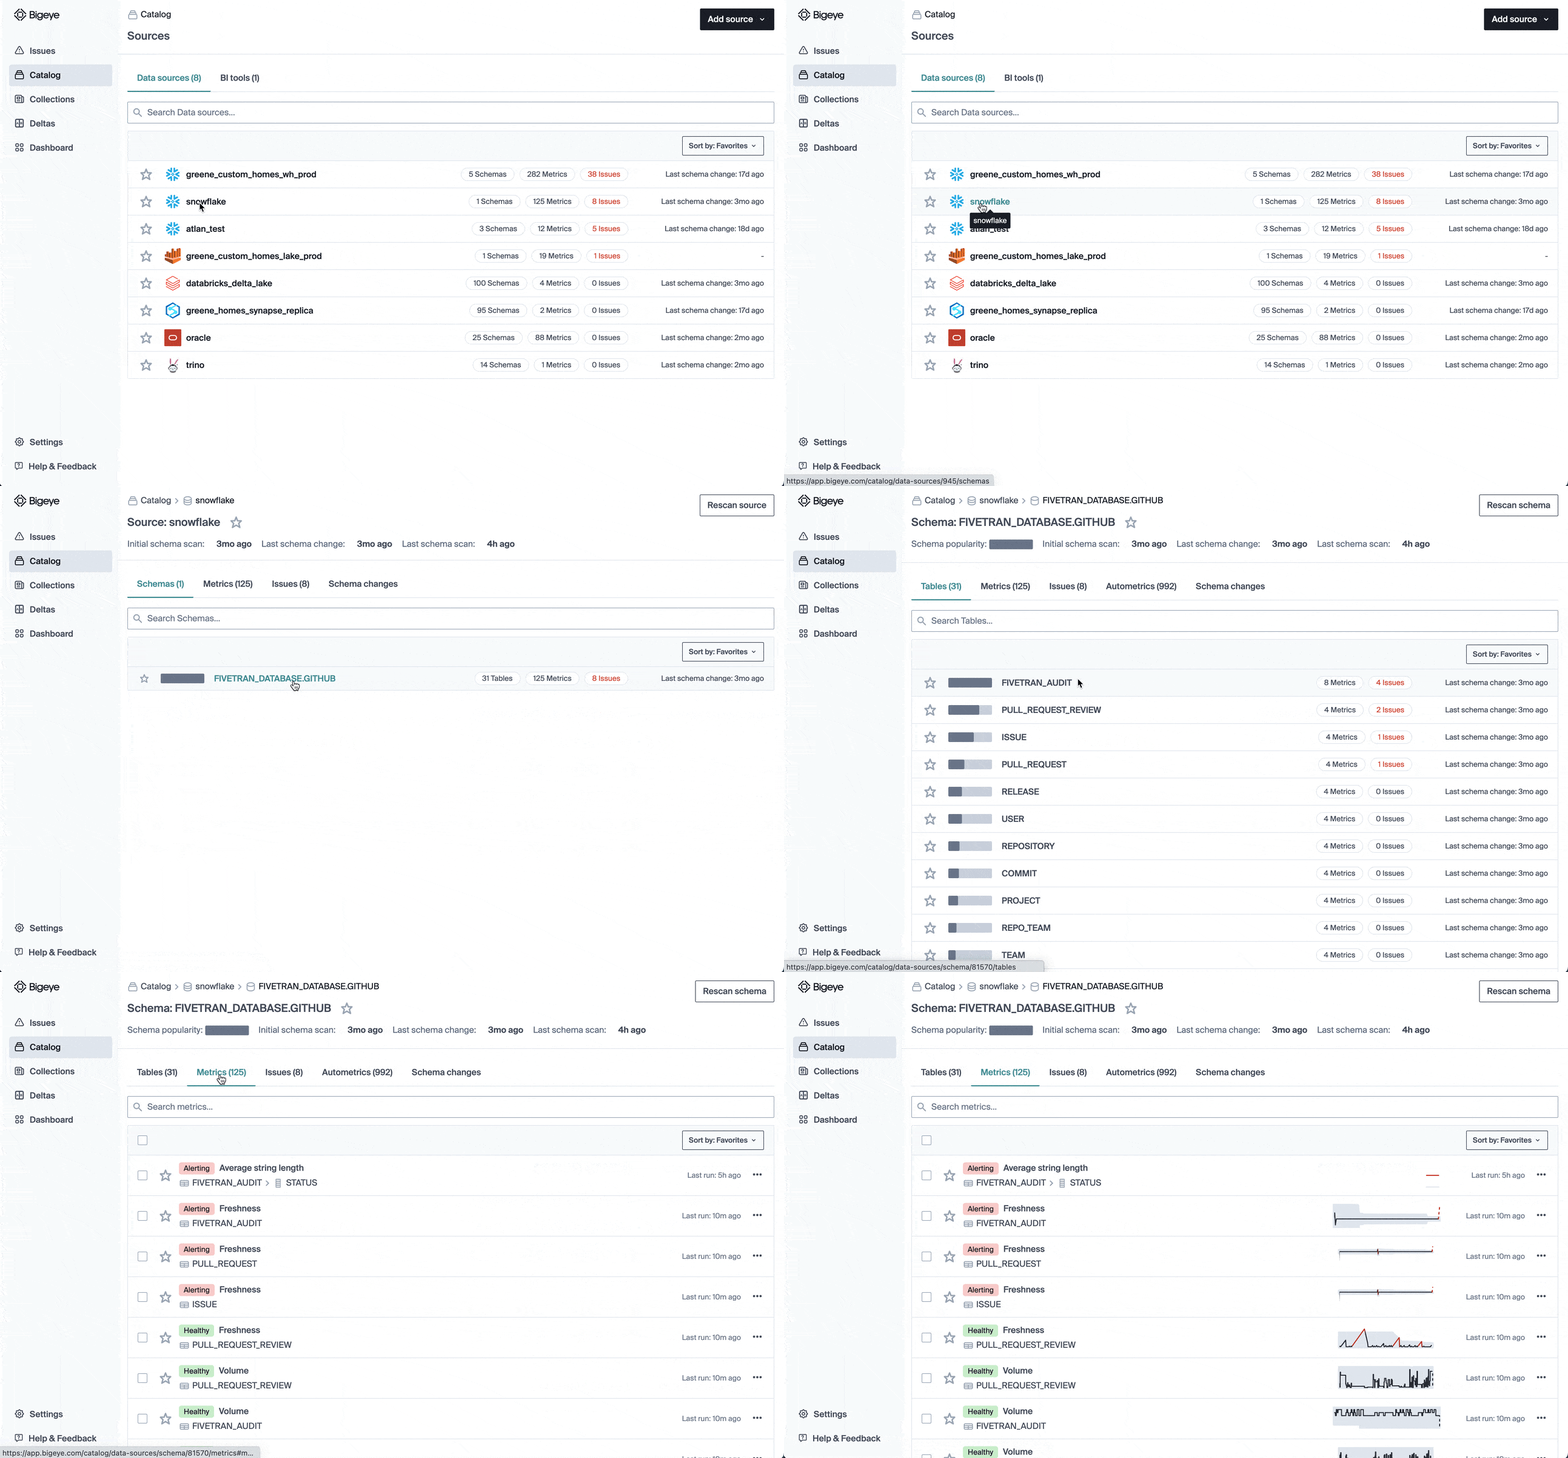
On Metrics pages, you can select one or more metrics and add them to a Collection by selecting Add to collection from the Action dropdown. In this modal we can see that the Collection we created is available in the dropdown, so we select that collection.
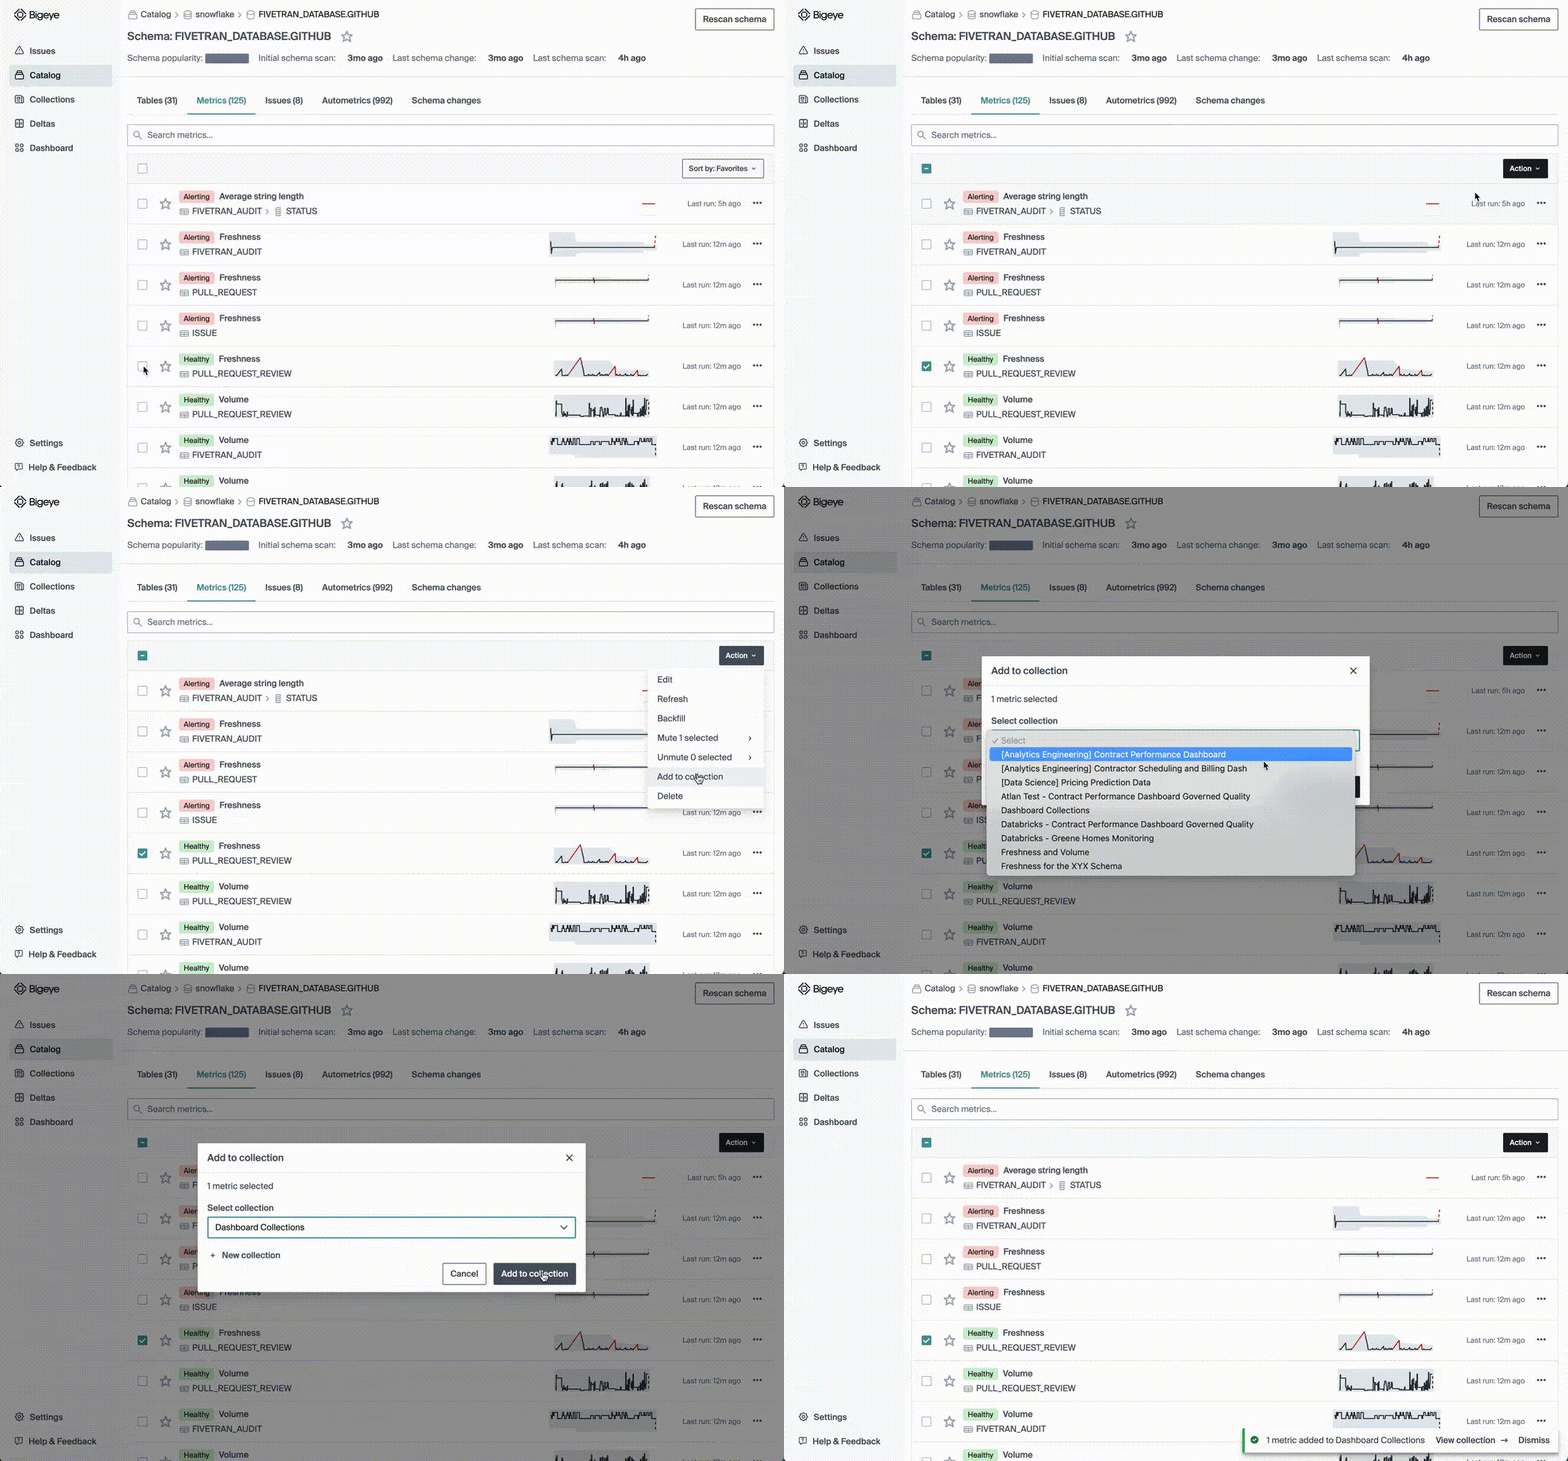
The Collection will alert when any of the metrics in its grouping are alerting.
Once the metrics are added we can quickly navigate back to the Collection with the link in the success alert. You should now be able to see the metrics in the Collection (you may have to refresh).
You can find more information about managing Collections here.
Updated 8 months ago
