
Deploy Metrics
You can now deploy metrics from the schema, table, or column level.
To deploy metrics, follow these steps:
- Navigate to a schema, table, or column page, and click Add Metrics on the top right of your screen.
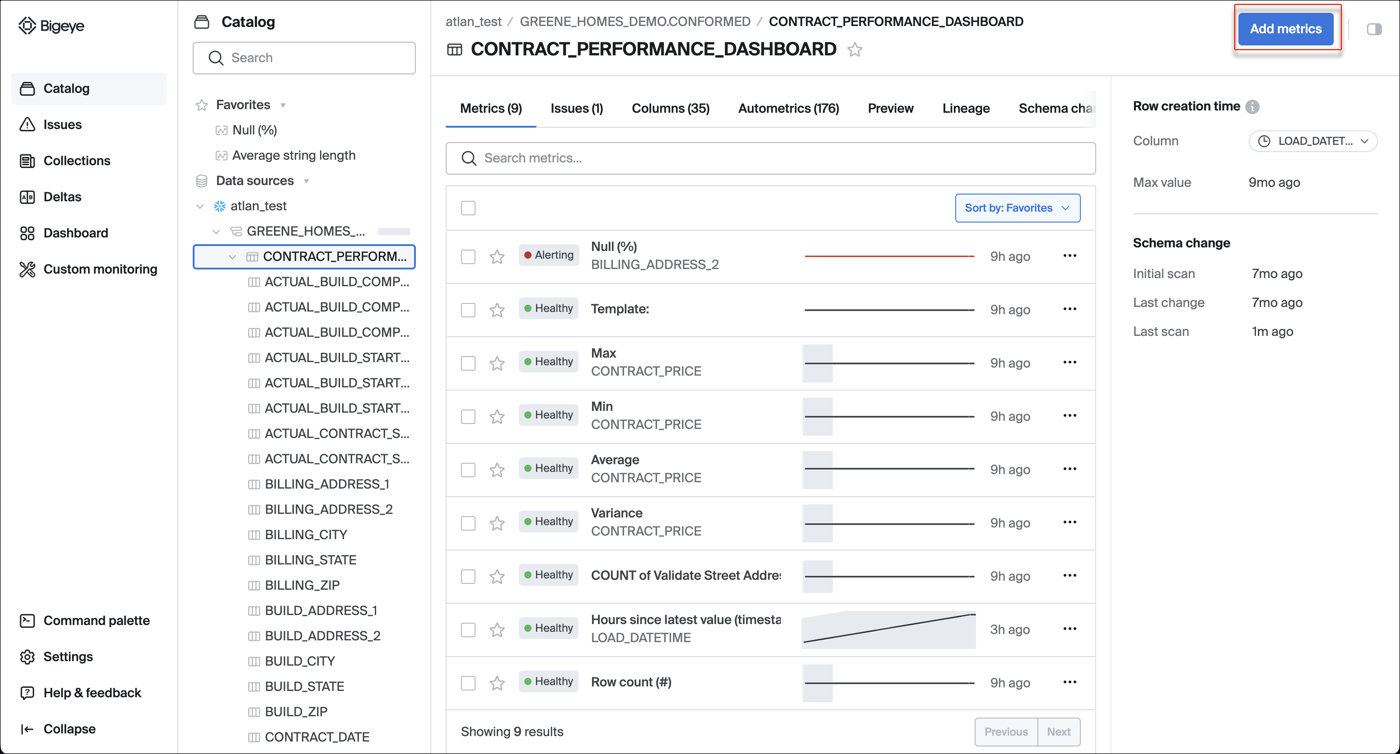
The metric deployment modal is displayed.
- Select the metric dimension from the three listed categories:
- Pipeline reliability
- Data quality
- All metrics
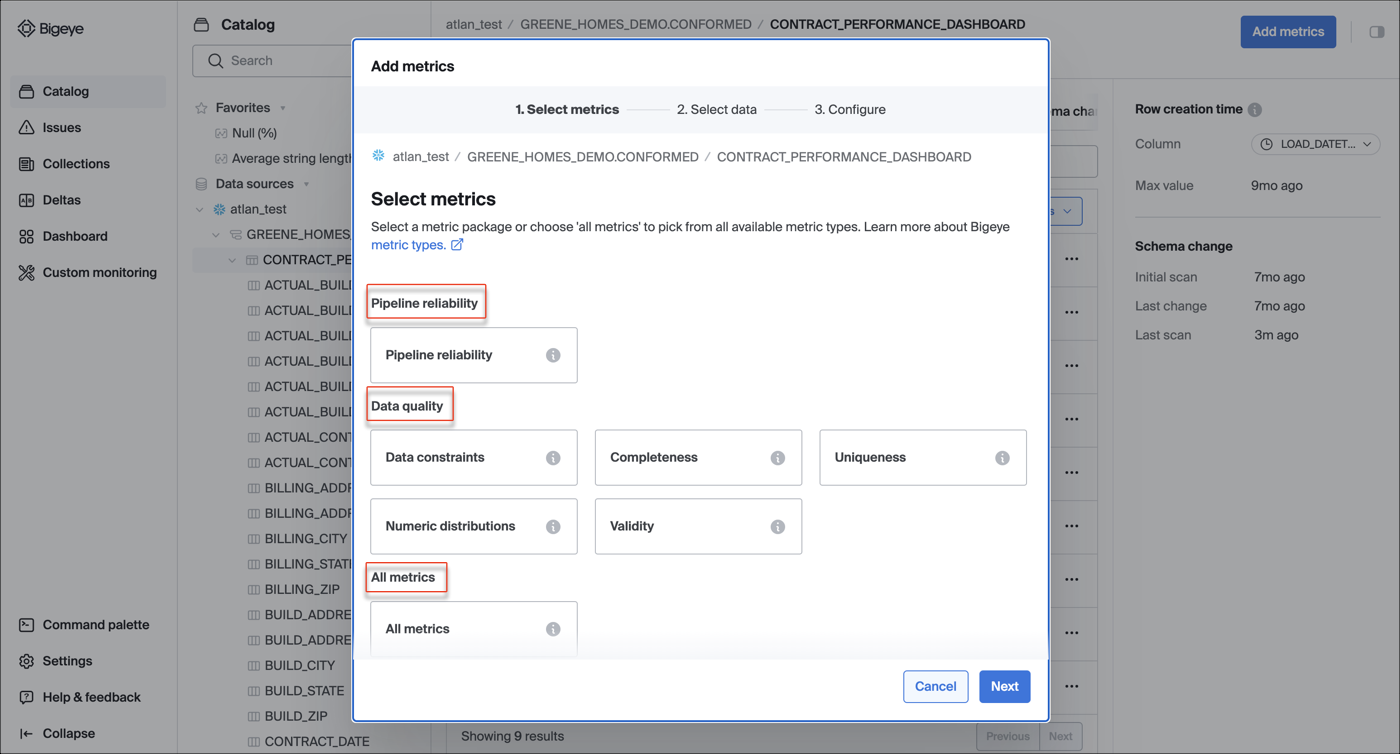
To learn more about Bigeye metric dimensions, see Available Metrics.
Each metric dimension has a list of recommended metrics that are commonly deployed. For example, the recommended metrics in the completeness metric dimension are Null (%), NaN (%), and Empty String (%).
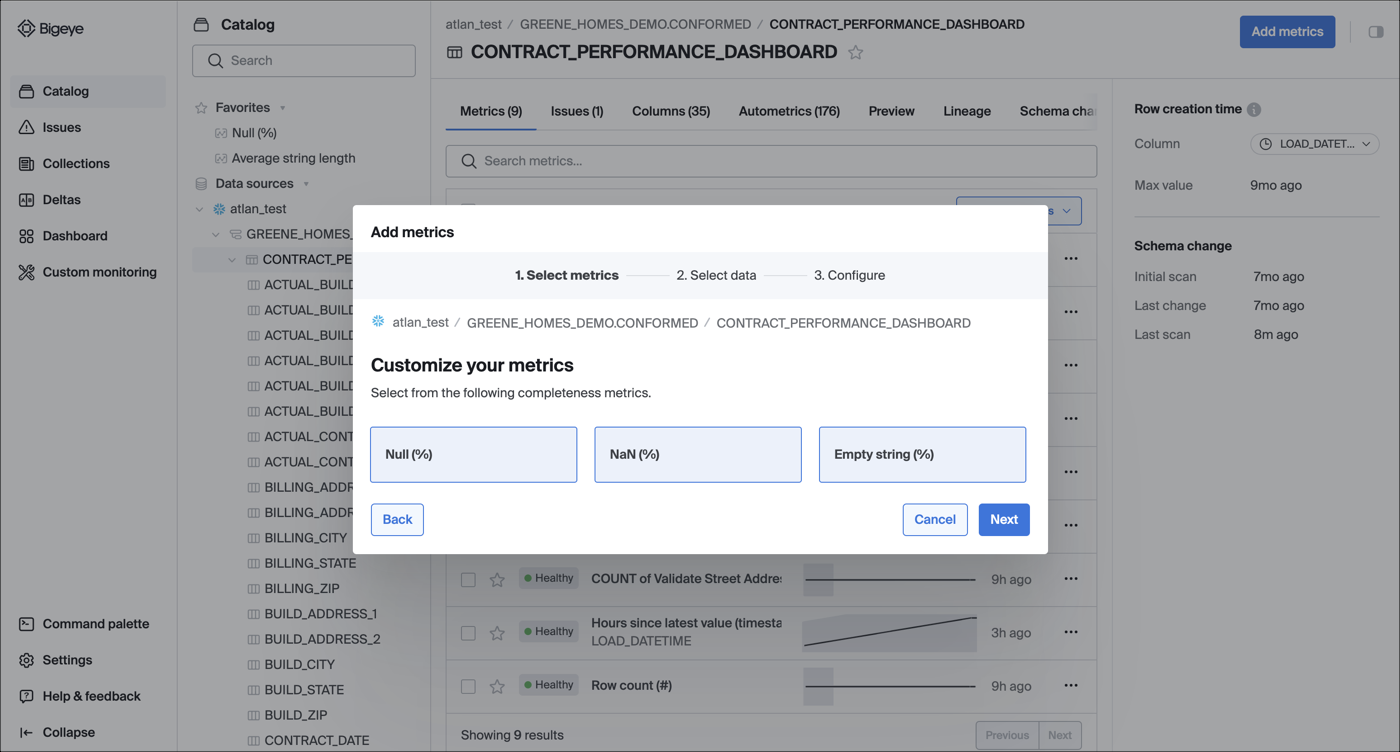
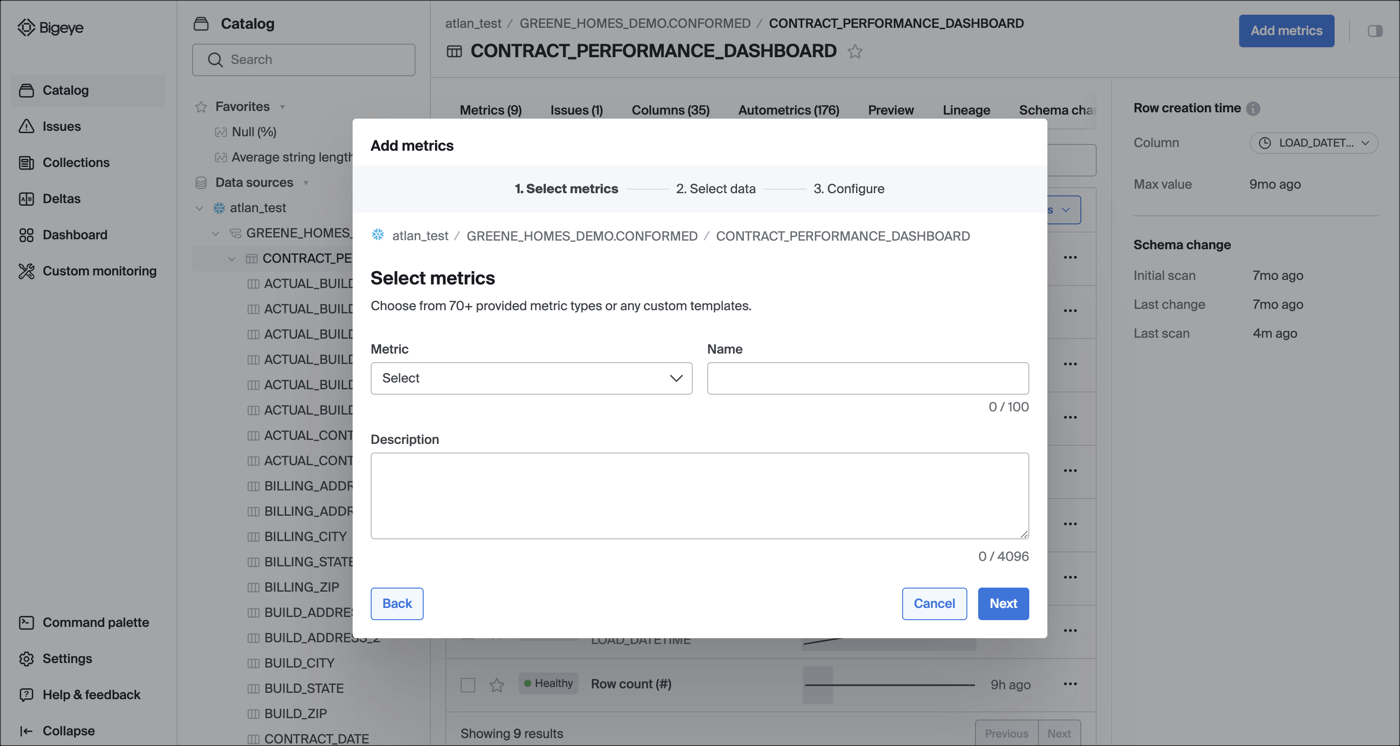
If you want to deploy a metric other than the recommended options or you want to deploy a template metric, click Back and select All metrics from the All metrics category. You can choose metrics from 70+ provided metric types or any custom templates. To learn more about template metrics, see Templates.
After you select your metric bundle and the metrics you want to deploy, click Next.
- Select the columns to monitor. Depending on the metric you selected, Bigeye automatically recommends columns to deploy metrics, or tables if you are deploying pipeline reliability metrics.
Bigeye recommends columns based on metric type. For example, if you chose Null (%) and NaN (%), for Null (%), Bigeye shows all columns as that metric could apply to any column, and for NaN (%) it's only numeric columns in supported sources.
For validity metrics, the columns are recommended based on name. For example, if you select email, Bigeye shows all columns that include email. If there are no columns to recommend, all columns are displayed.
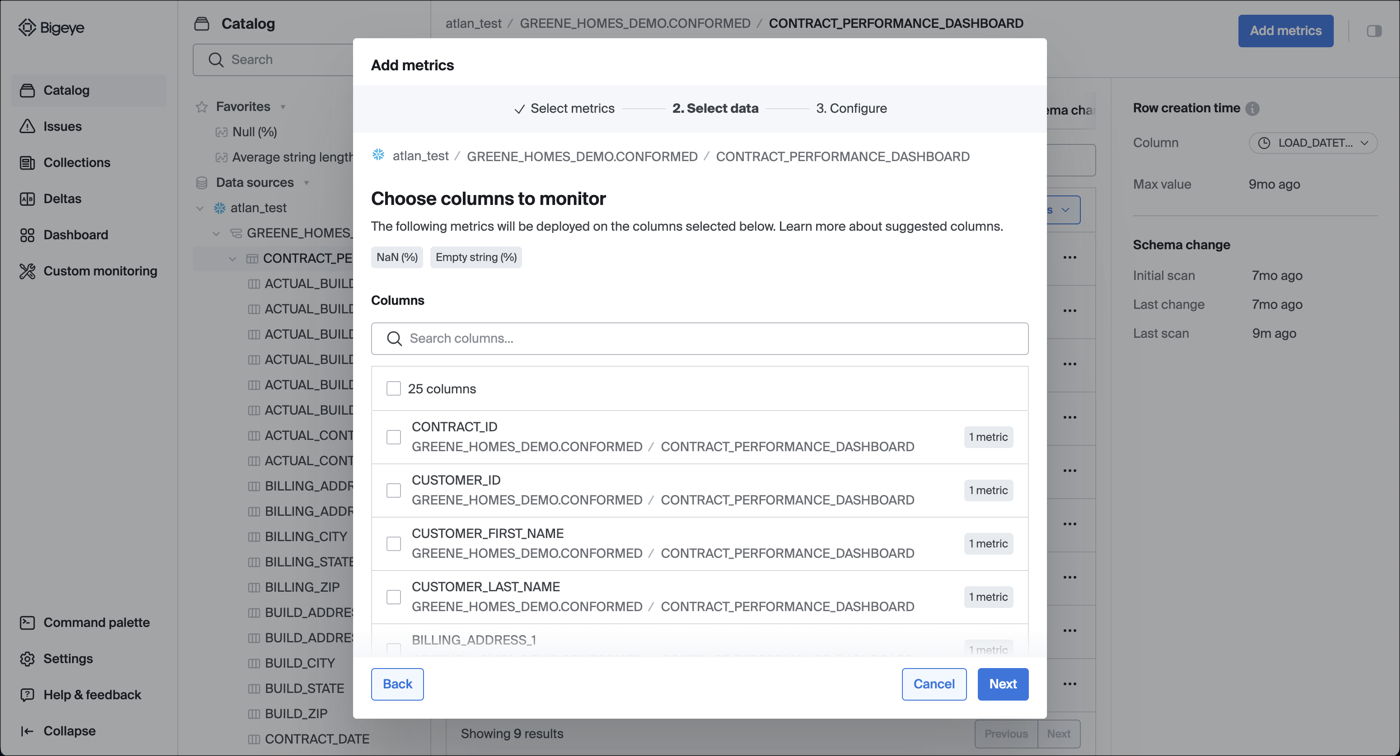
You can also search for the columns you want to deploy the metrics on or you can select the top left checkbox to apply metrics to all recommended columns.
You can search by schema, source, or table.
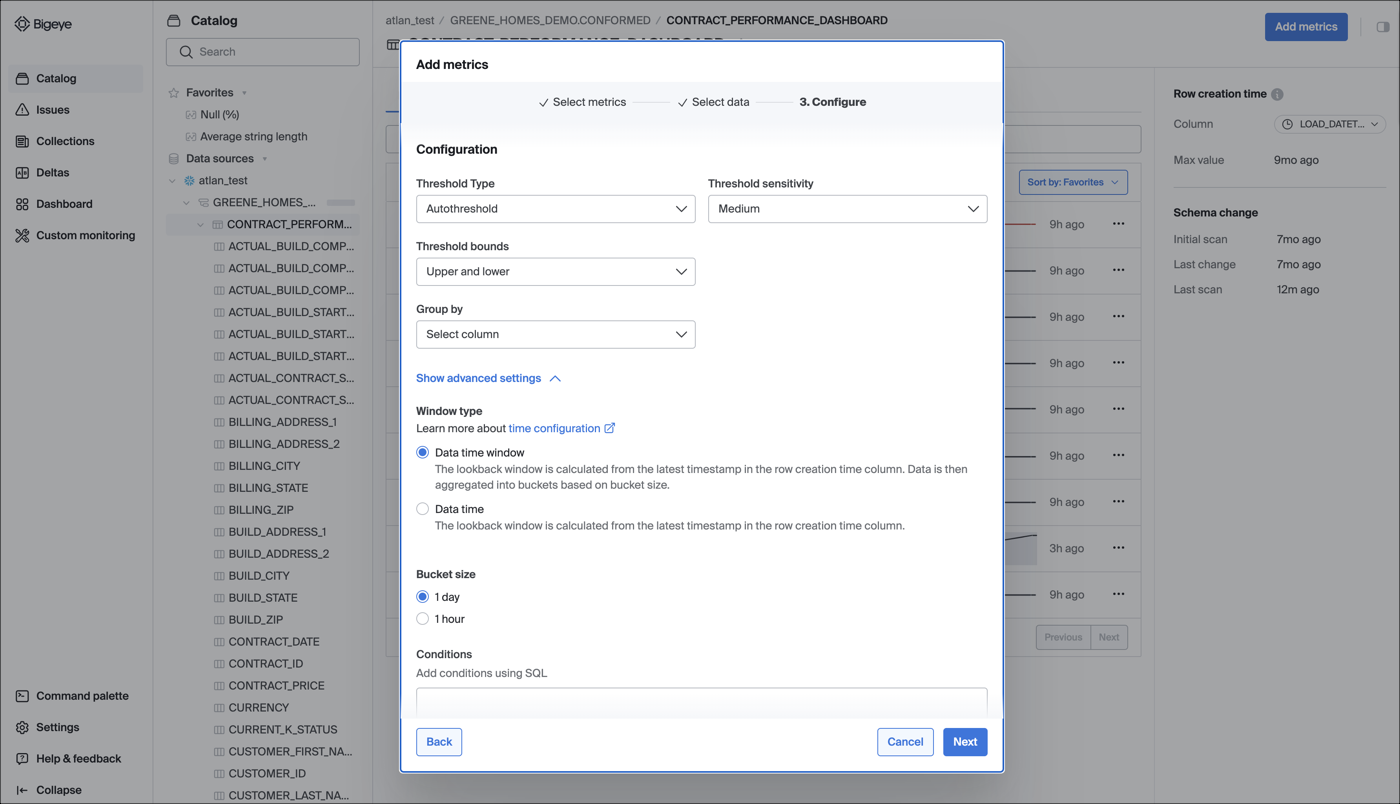
- Set the metric schedule, lookback window, and row creation time. You can set row creation time for each table you are deploying metrics on. If there is no row creation time column, the value defaults to None and triggers a full table scan. If you have row creation time set on the table, you see a filter on the metric column, which defaults to 2 days of lookback.

You can also further configure the settings that determine when a metric alerts. These settings include:
- Select threshold type, threshold sensitivity, and threshold bounds. To learn more about thresholds, see Thresholds.
- If you are deploying metrics within the same table, you can choose a column to perform a group by on.
Group by option isn't displayed when you deploy metrics across multiple tables.
- Add your filters by writing raw SQL WHERE conditions in the text input box.
After you have defined the configuration, click Next. A Deploy modal opens where you can confirm all the selected metrics that you want to deploy. You can also add these metrics to a collection.
You cannot create a new collection from Configure metrics modal.
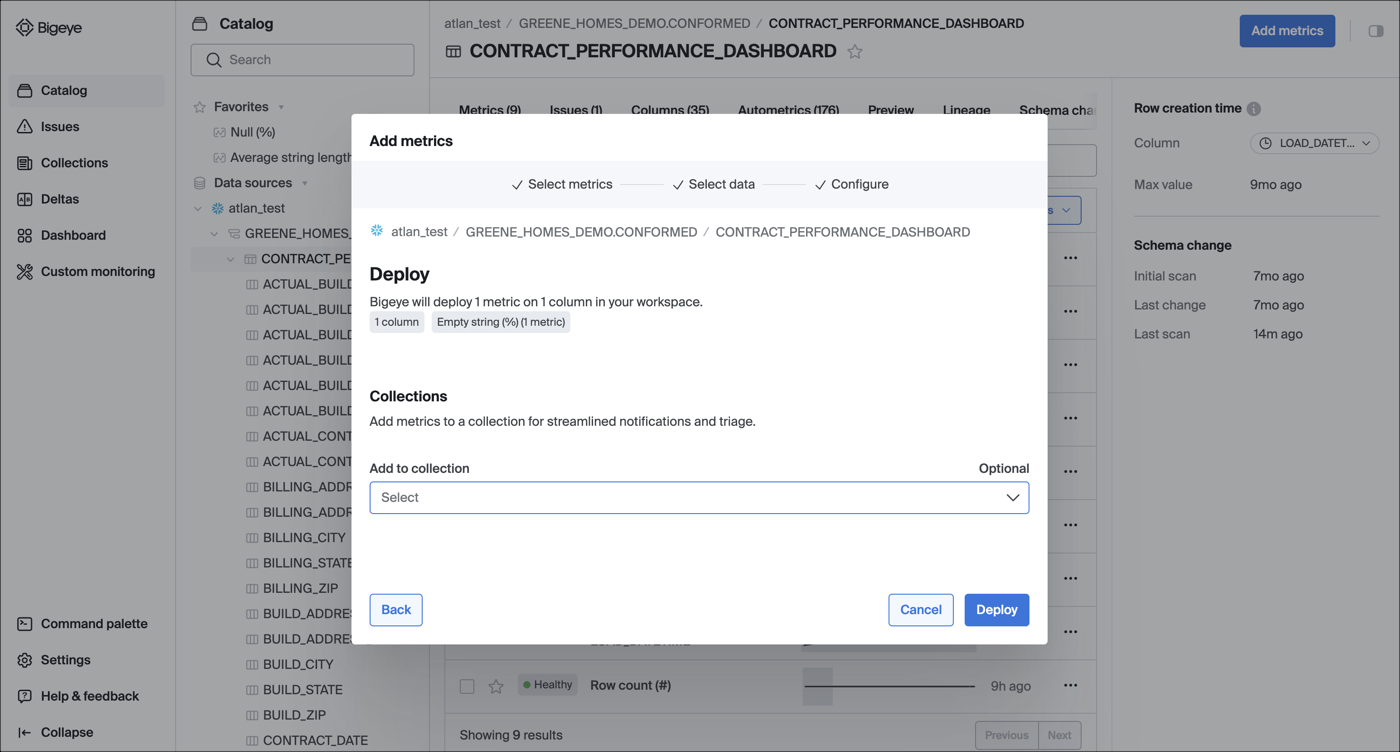
Confirm the selected metrics and then click Deploy. The metrics are deployed, and the related schema, table, or column page is displayed. You can see metrics sorted by the Latest created under the Metrics tab.
Updated 9 months ago