
Getting Started
Start creating complete observability across your enterprise data landscape.
Overview
- Connect to your source(s) quickly and securely
- Use Autometrics to rapidly deploy monitoring across your data pipelines
- Use Collections to organize your monitoring and route alerts
- Use Issues and Incidents to root cause and resolve data problems
- Explore advanced features like metric customization
1. Connect your source(s)
You can find our supported sources and instructions to connect each type under Data Sources. In general, we recommend creating a new service account and provisioning it only with the required permissions for the data you wish to monitor with Bigeye. To add a new source, go to Catalog > Add source. Note only admin users will be able to add new sources.
For some sources (Snowflake, BigQuery, Redshift), you will have the option to deploy Metadata Metrics right away. Metadata Metrics ensure every table is monitored for “time since last load” and “number of rows inserted”. This ensures you have broad coverage monitoring for the most common data quality problems.
Once your source is connected, Bigeye will automatically profile your data in order to recommend Autometrics, or suggested metrics to ensure your data is consistently accurate and reliable. To learn more about the heuristics used to recommend Autometrics, see Available Metrics.

2. Deploy Monitoring
Autometrics are suggested metrics that monitor anomalies in your data. Autometrics are automatically generated for all new datasets added to Bigeye. You can find Autometrics in the Catalog when viewing a source, schema, table or column page—or on the Lineage page once you've selected a target table, column, or schema.
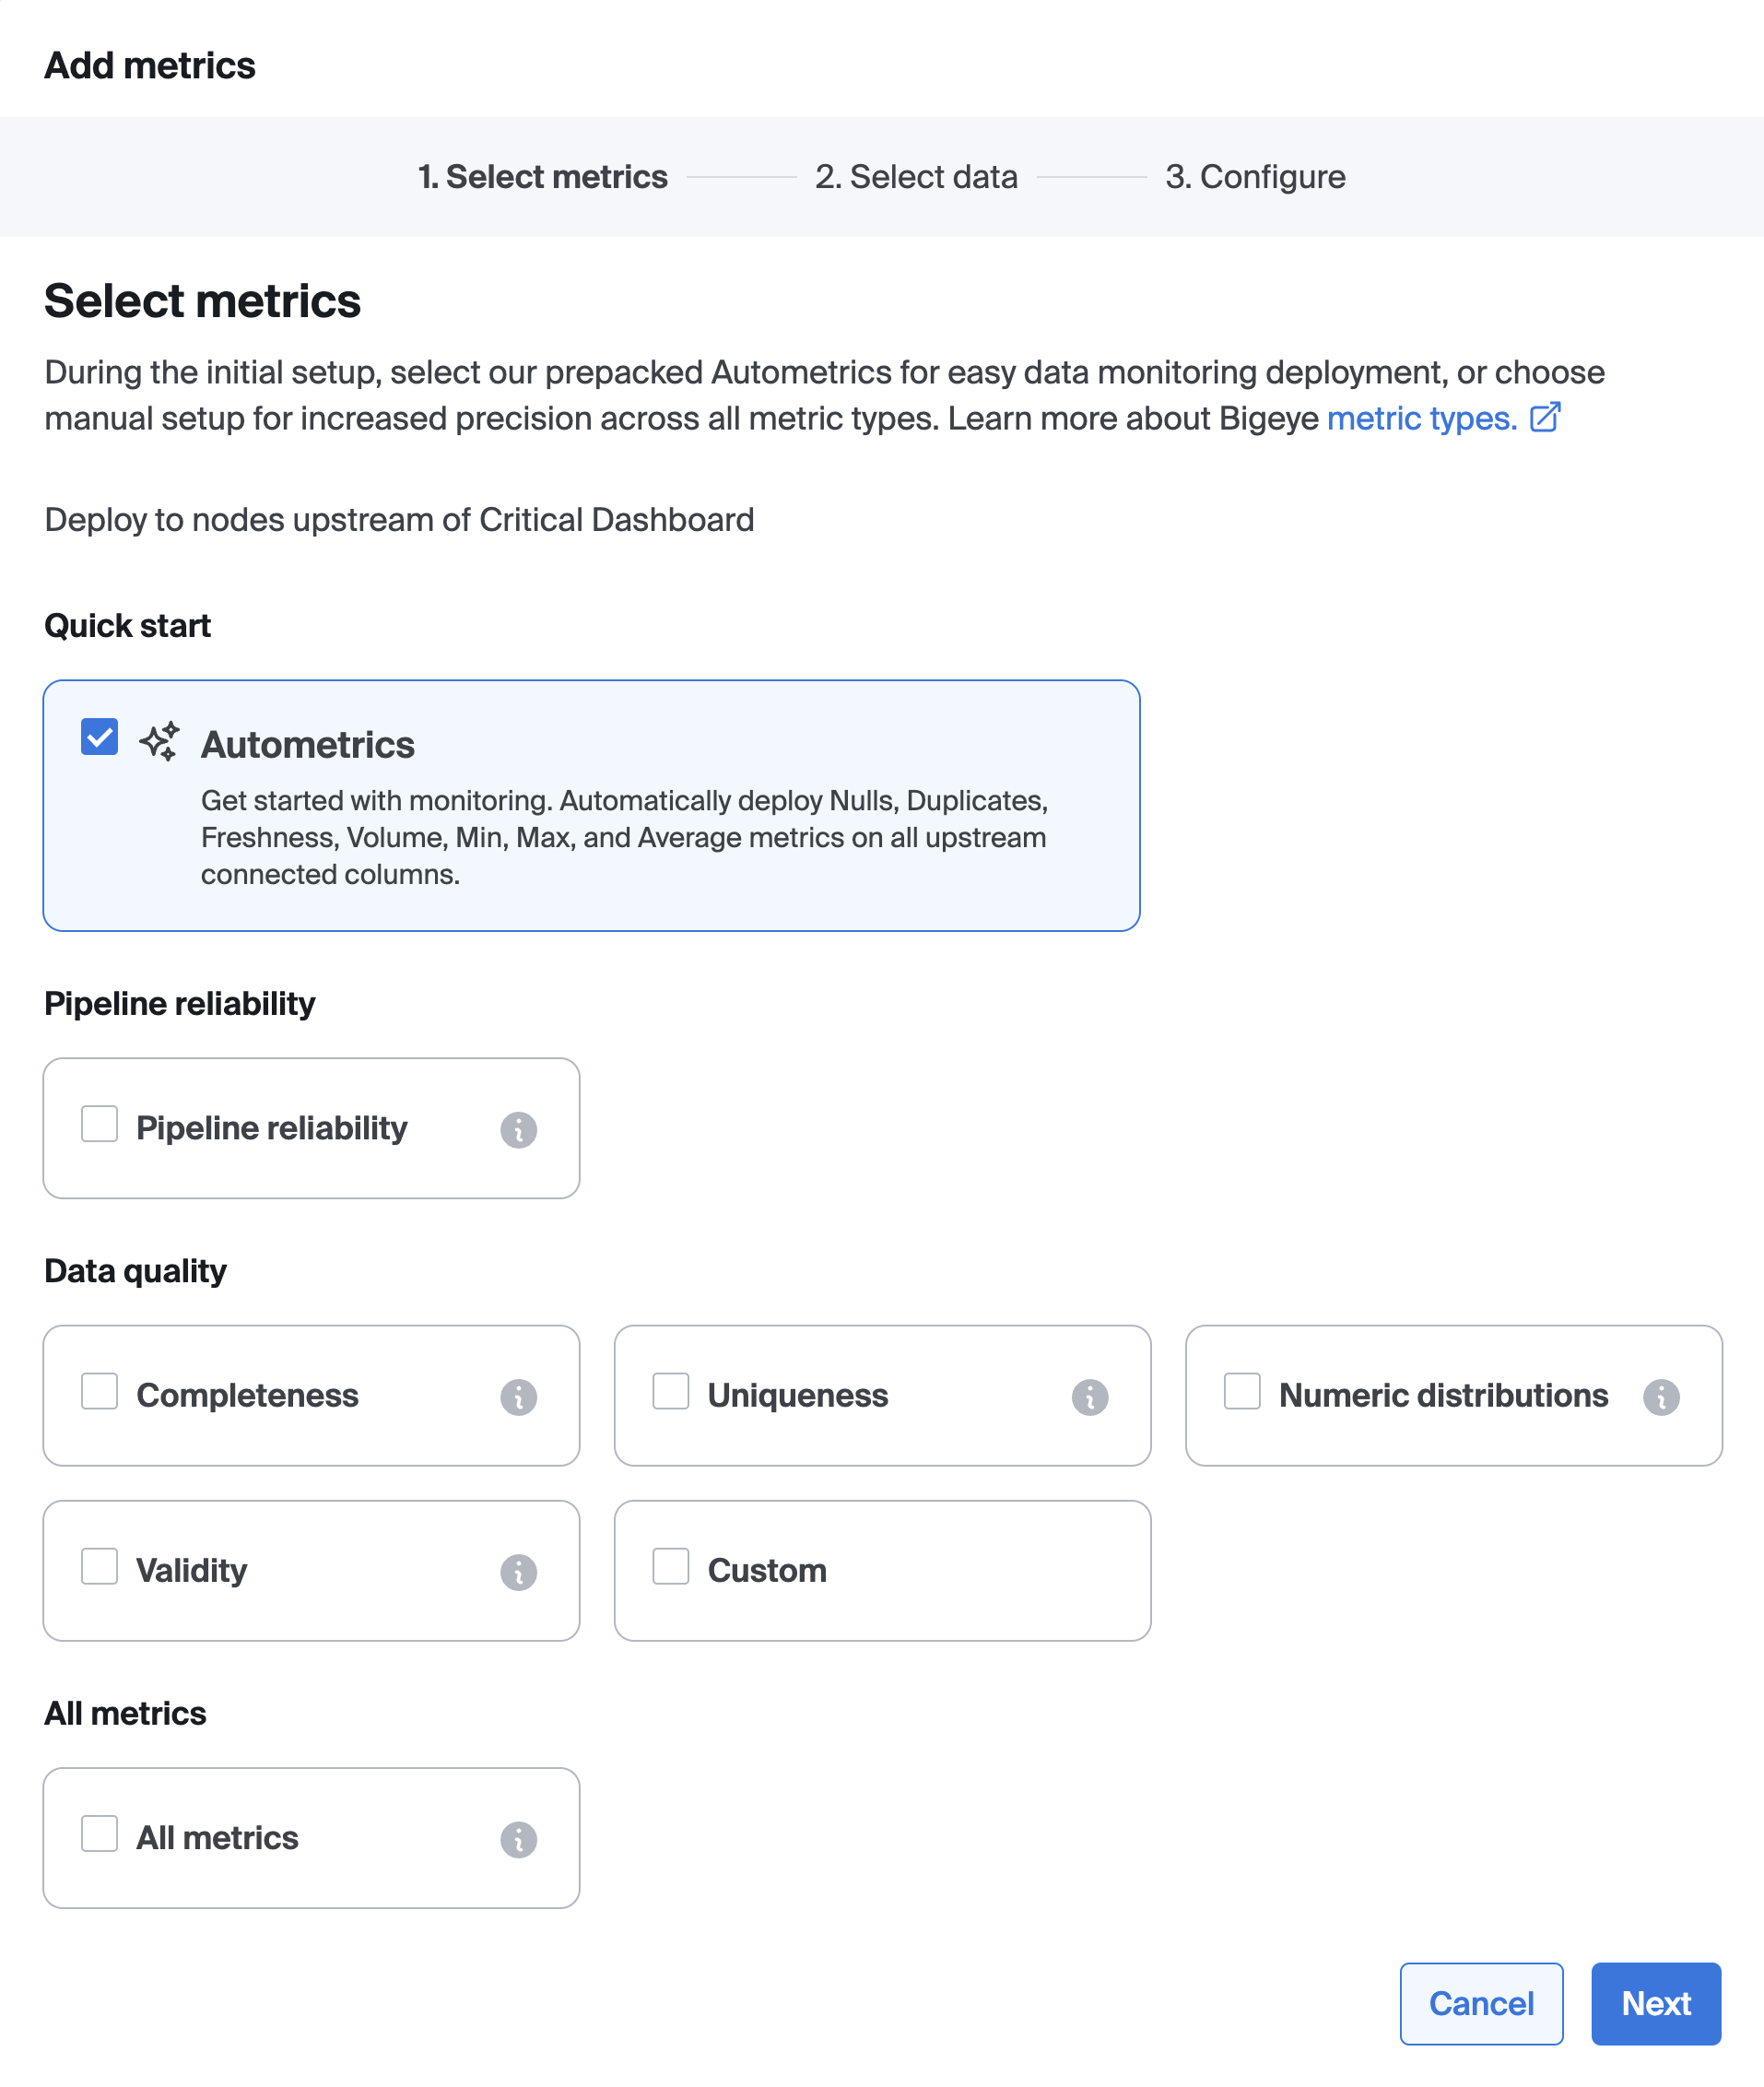
You can search, or use filters, to find metrics relevant to your monitoring goals. Select the relevant Autometrics, and click “enable”. By default, Bigeye metrics use Autothresholds to detect anomalies in your data and send alerts, so there’s no need to manually define thresholds. You have the option to configure metrics by setting a row creation time. Once a table's row creation time is set, Bigeye backfills metric history and enables Autothresholds without a training period.
3. Organize with Collections
Collections group relevant metrics together to consolidate statuses, notifications, and issues for data owners and stakeholders. For example, you may wish to group all metrics on ingest tables together in an ingest collection, all metrics for a specific pipeline in a pipeline collection, or all metrics on a dashboard reporting table in a dashboard collection.
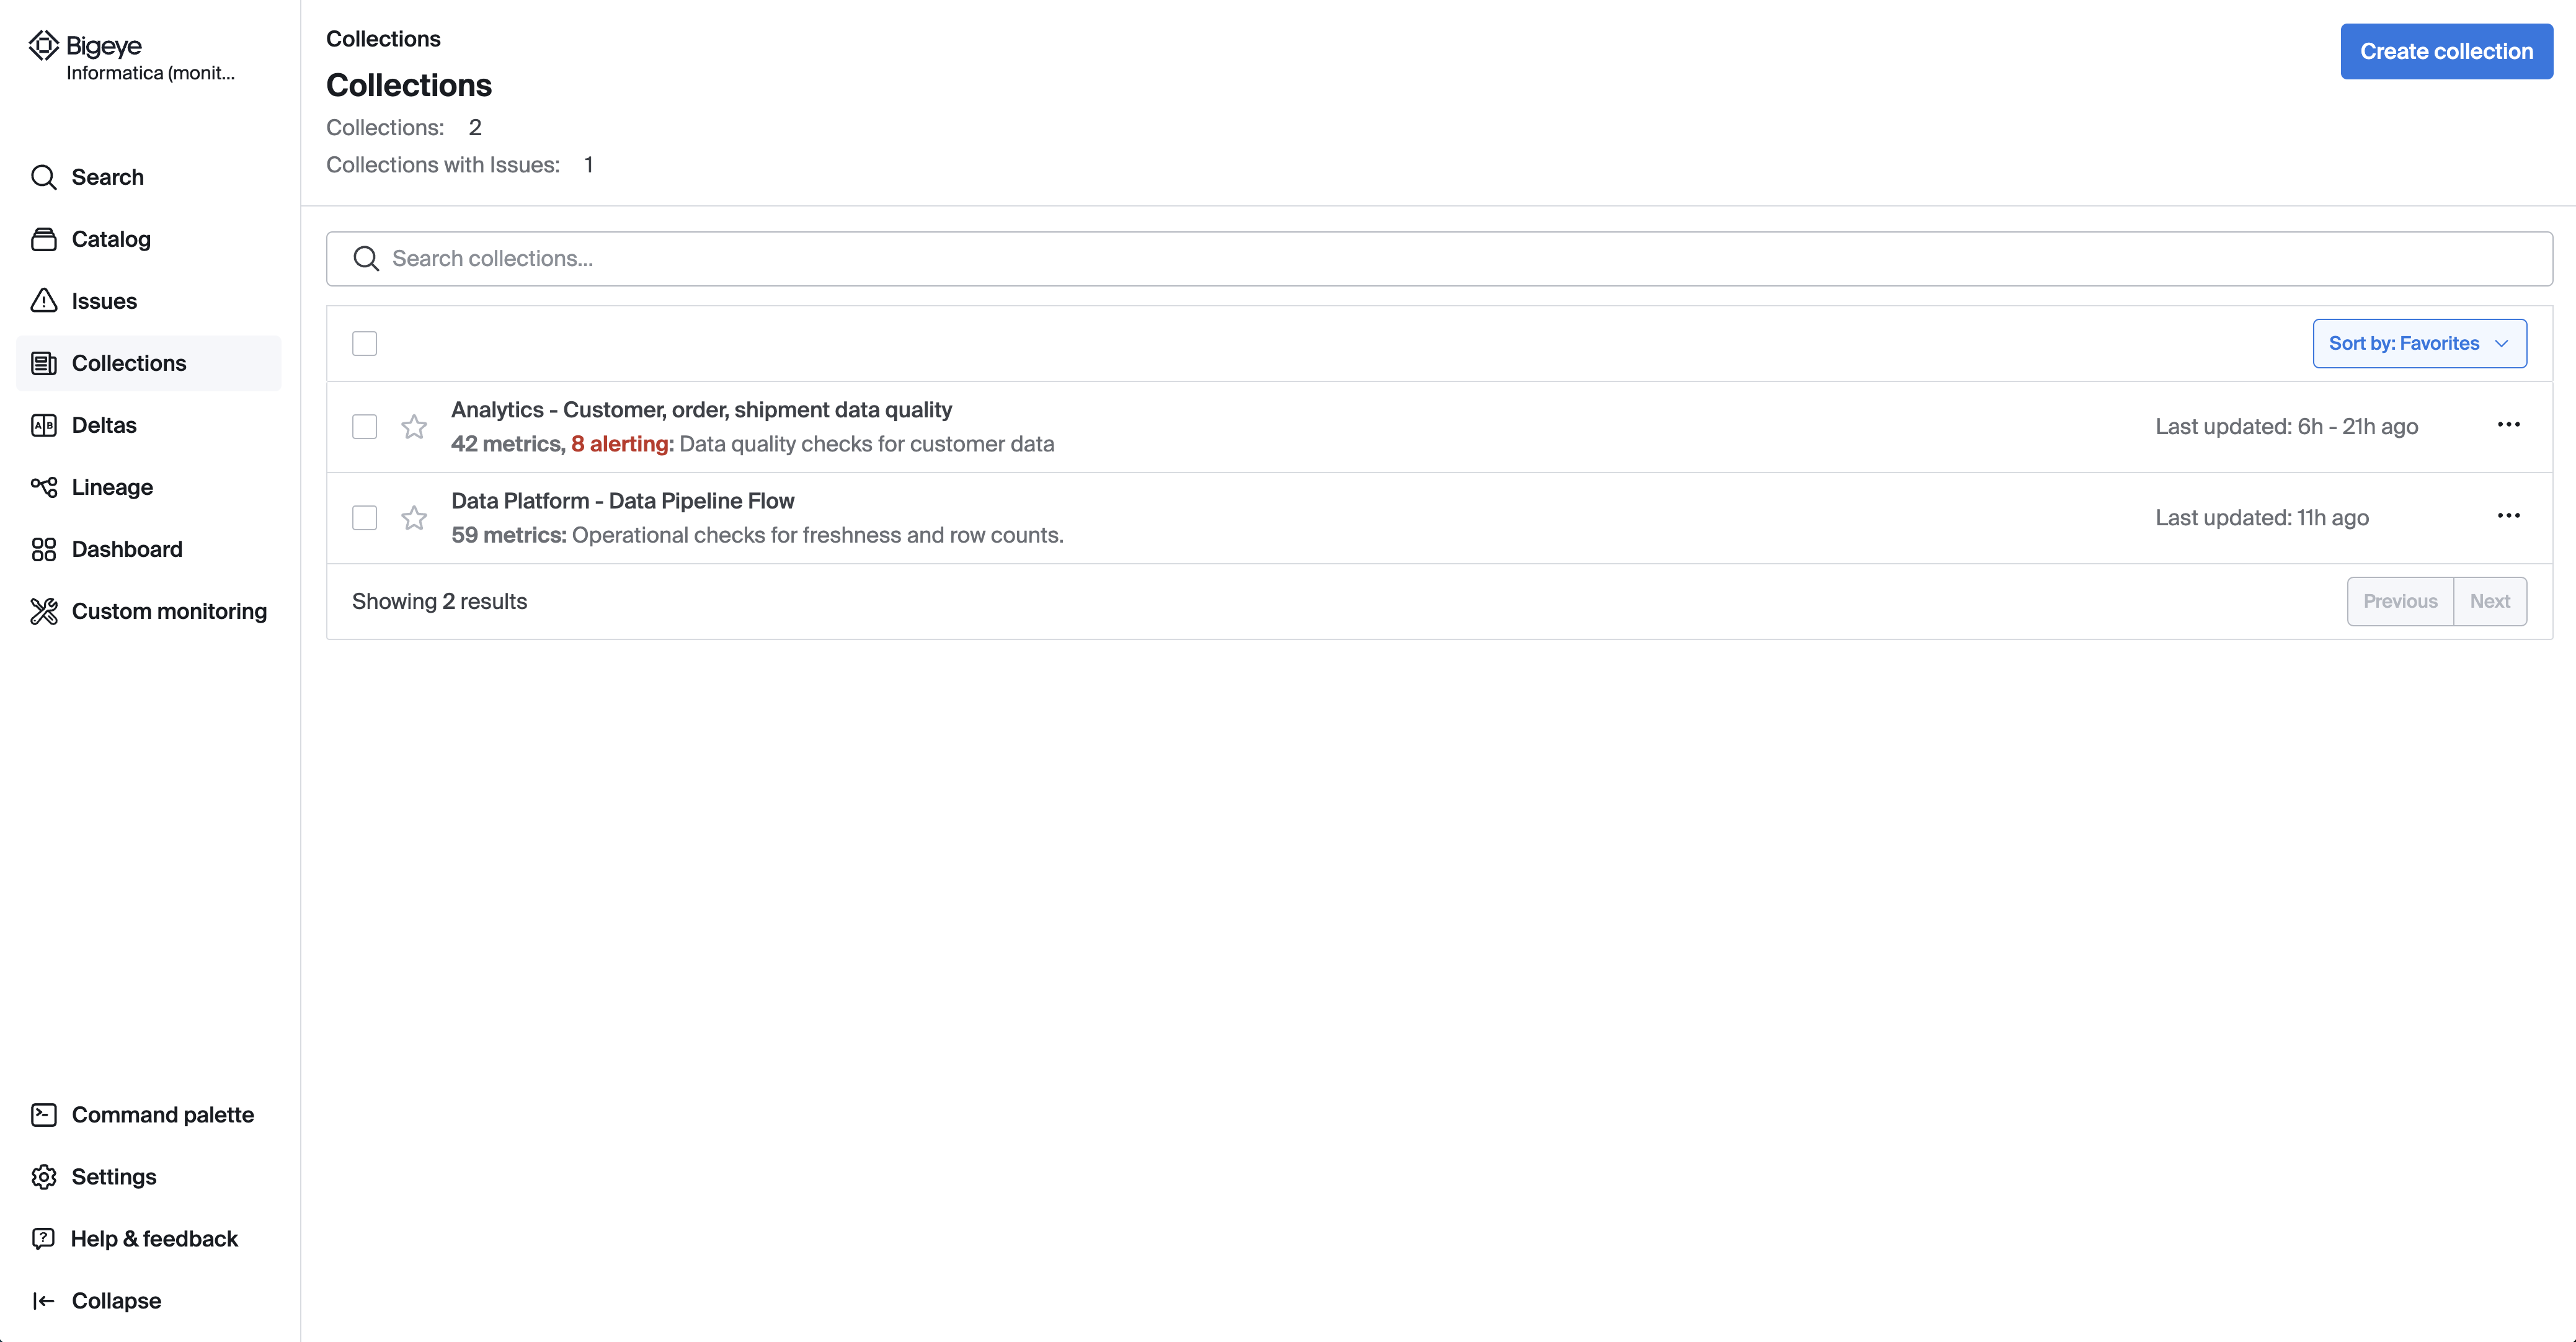
To add metrics to a Collection, select “metrics” in the catalog and click “action” > “Add to Collection”. Here you can create a new Collection or select an existing Collection.
On the Collections page, you can view the status of all metrics in the collection and triage-related issues. We recommend setting notifications, via either Slack or email on a collection.
4. Triage and Resolve Issues
When Bigeye metrics detect values outside of the expected threshold, an Issue is created. Issues help your team triage and resolve data quality problems. Related Issues are combined together into Incidents so they can be managed in bulk.
If you have notifications configured on a metric, or any collection that metric is a part of, you will receive a notification when an Issue is created with a link. Alternatively, you can triage all issues from the Collections page, any catalog page, or the Issues tab in the Bigeye app, depending on what data is relevant to you.
You can acknowledge, mute, or close issues to track progress on resolution. Choosing to acknowledge an issue will automatically mute it for 24 hours.
5. Advanced features
Once you’ve set up Bigeye metrics and collections on your priority datasets, you can explore Bigeye’s advanced features to ensure even business-specific data requirements are monitored.
Take advantage of virtual tables and template metrics to monitor business rules. Setup deltas to monitor data migrations between sources or changes between dataset versions.
Updated 8 months ago