
Browser Extension
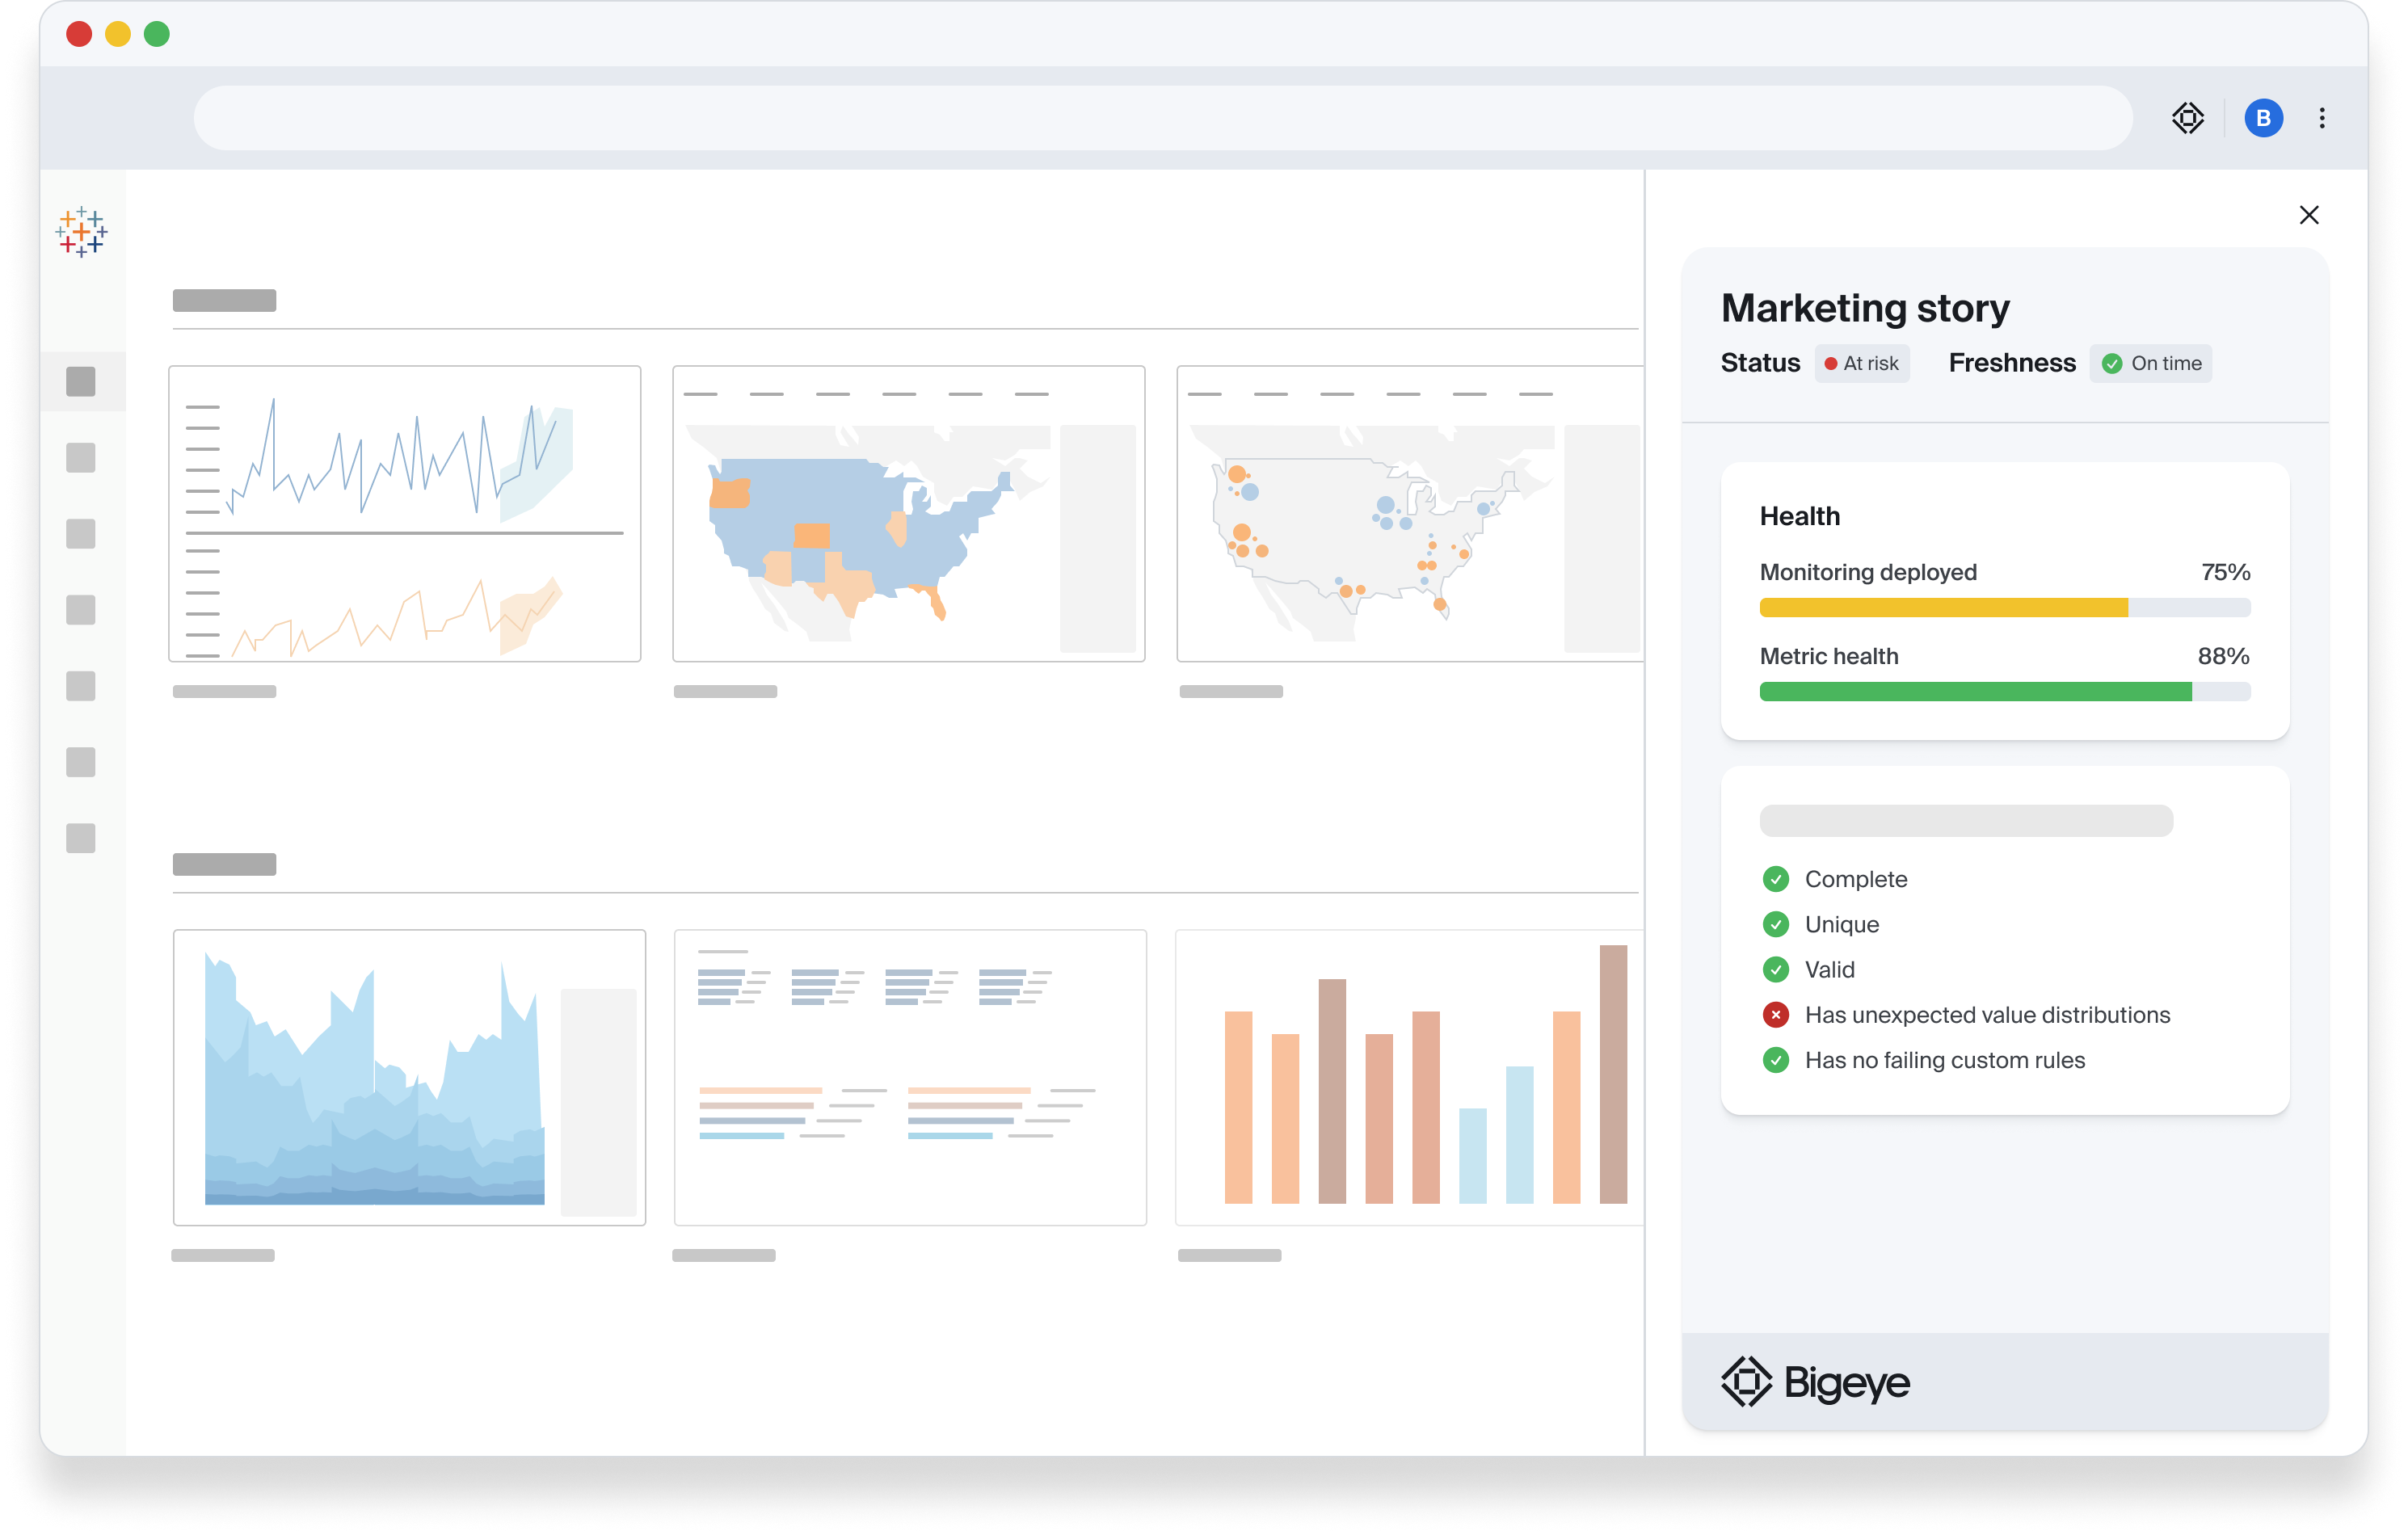
The Bigeye browser extension surfaces data quality information directly in the side panel of the browser for supported websites. Use the browser extension to ensure that business critical dashboards are using data that is actively monitored and guaranteed of high quality before making any decisions off of that underlying data. This extension automatically finds matching Bigeye resources as you browse in the web of supported websites and displays all of the data quality information in the side panel of your browser. When using Bigeye's extension in a supported tool, it will only read the page title and URL of your browser tab.
Installation
The Bigeye browser extension can be found in the web stores at these respective links. Please speak with your Bigeye representative prior to installing this extension to ensure the functionality has been enabled.
- Chrome: https://chromewebstore.google.com/detail/bigeye/aimhmhpibambnknlhhiachnchfmiogob
- Edge: https://microsoftedge.microsoft.com/addons/detail/bigeye/bdjninjldiihecjbbboeicgmogahmbjm
If you are an administrator installing this extension for your organization, here are some helpful resources to install for chrome and edge.
- Chrome: Install marketplace apps for your organization
- Edge: Use group policies to manage Microsoft Edge extensions
Browser version supportThe Bigeye extension utilizes the side panel of the browser for optimum user experience. The side panel, and therefore the Bigeye extension, is only available in chrome versions 116+ and edge versions 119+.
Supported tools
Currently, the browser extension supports the following websites:
- Databricks: schemas and tables via Catalog explorer, and the SQL Editor
- Microsoft Power BI: pages, reports, and dashboards
- Snowflake: schemas and tables via Snowsight schema explorer, and worksheets
- Tableau: sheets, dashboards, and stories
How to use
Once enabled and installed, anyone with access to Bigeye and a supported website can utilize the browser extension.
Here are the summarized steps to use the extension (outlined in greater detail in the video above):
- Navigate to a dashboard on a supported site.
- Click on the extension icon in browser toolbar.
- Provide the extension with your Bigeye URL.
- Log in to Bigeye and close the window where you authenticated.
- Review the quality of the underlying data for that dashboard.
Updated 10 months ago