
Scorecard
See a summary of health for any schema, table, or column connected to Bigeye.
The scorecard is shown on the catalog source, schema, table, and column tables. Each page will show the scorecard for monitors in that entity
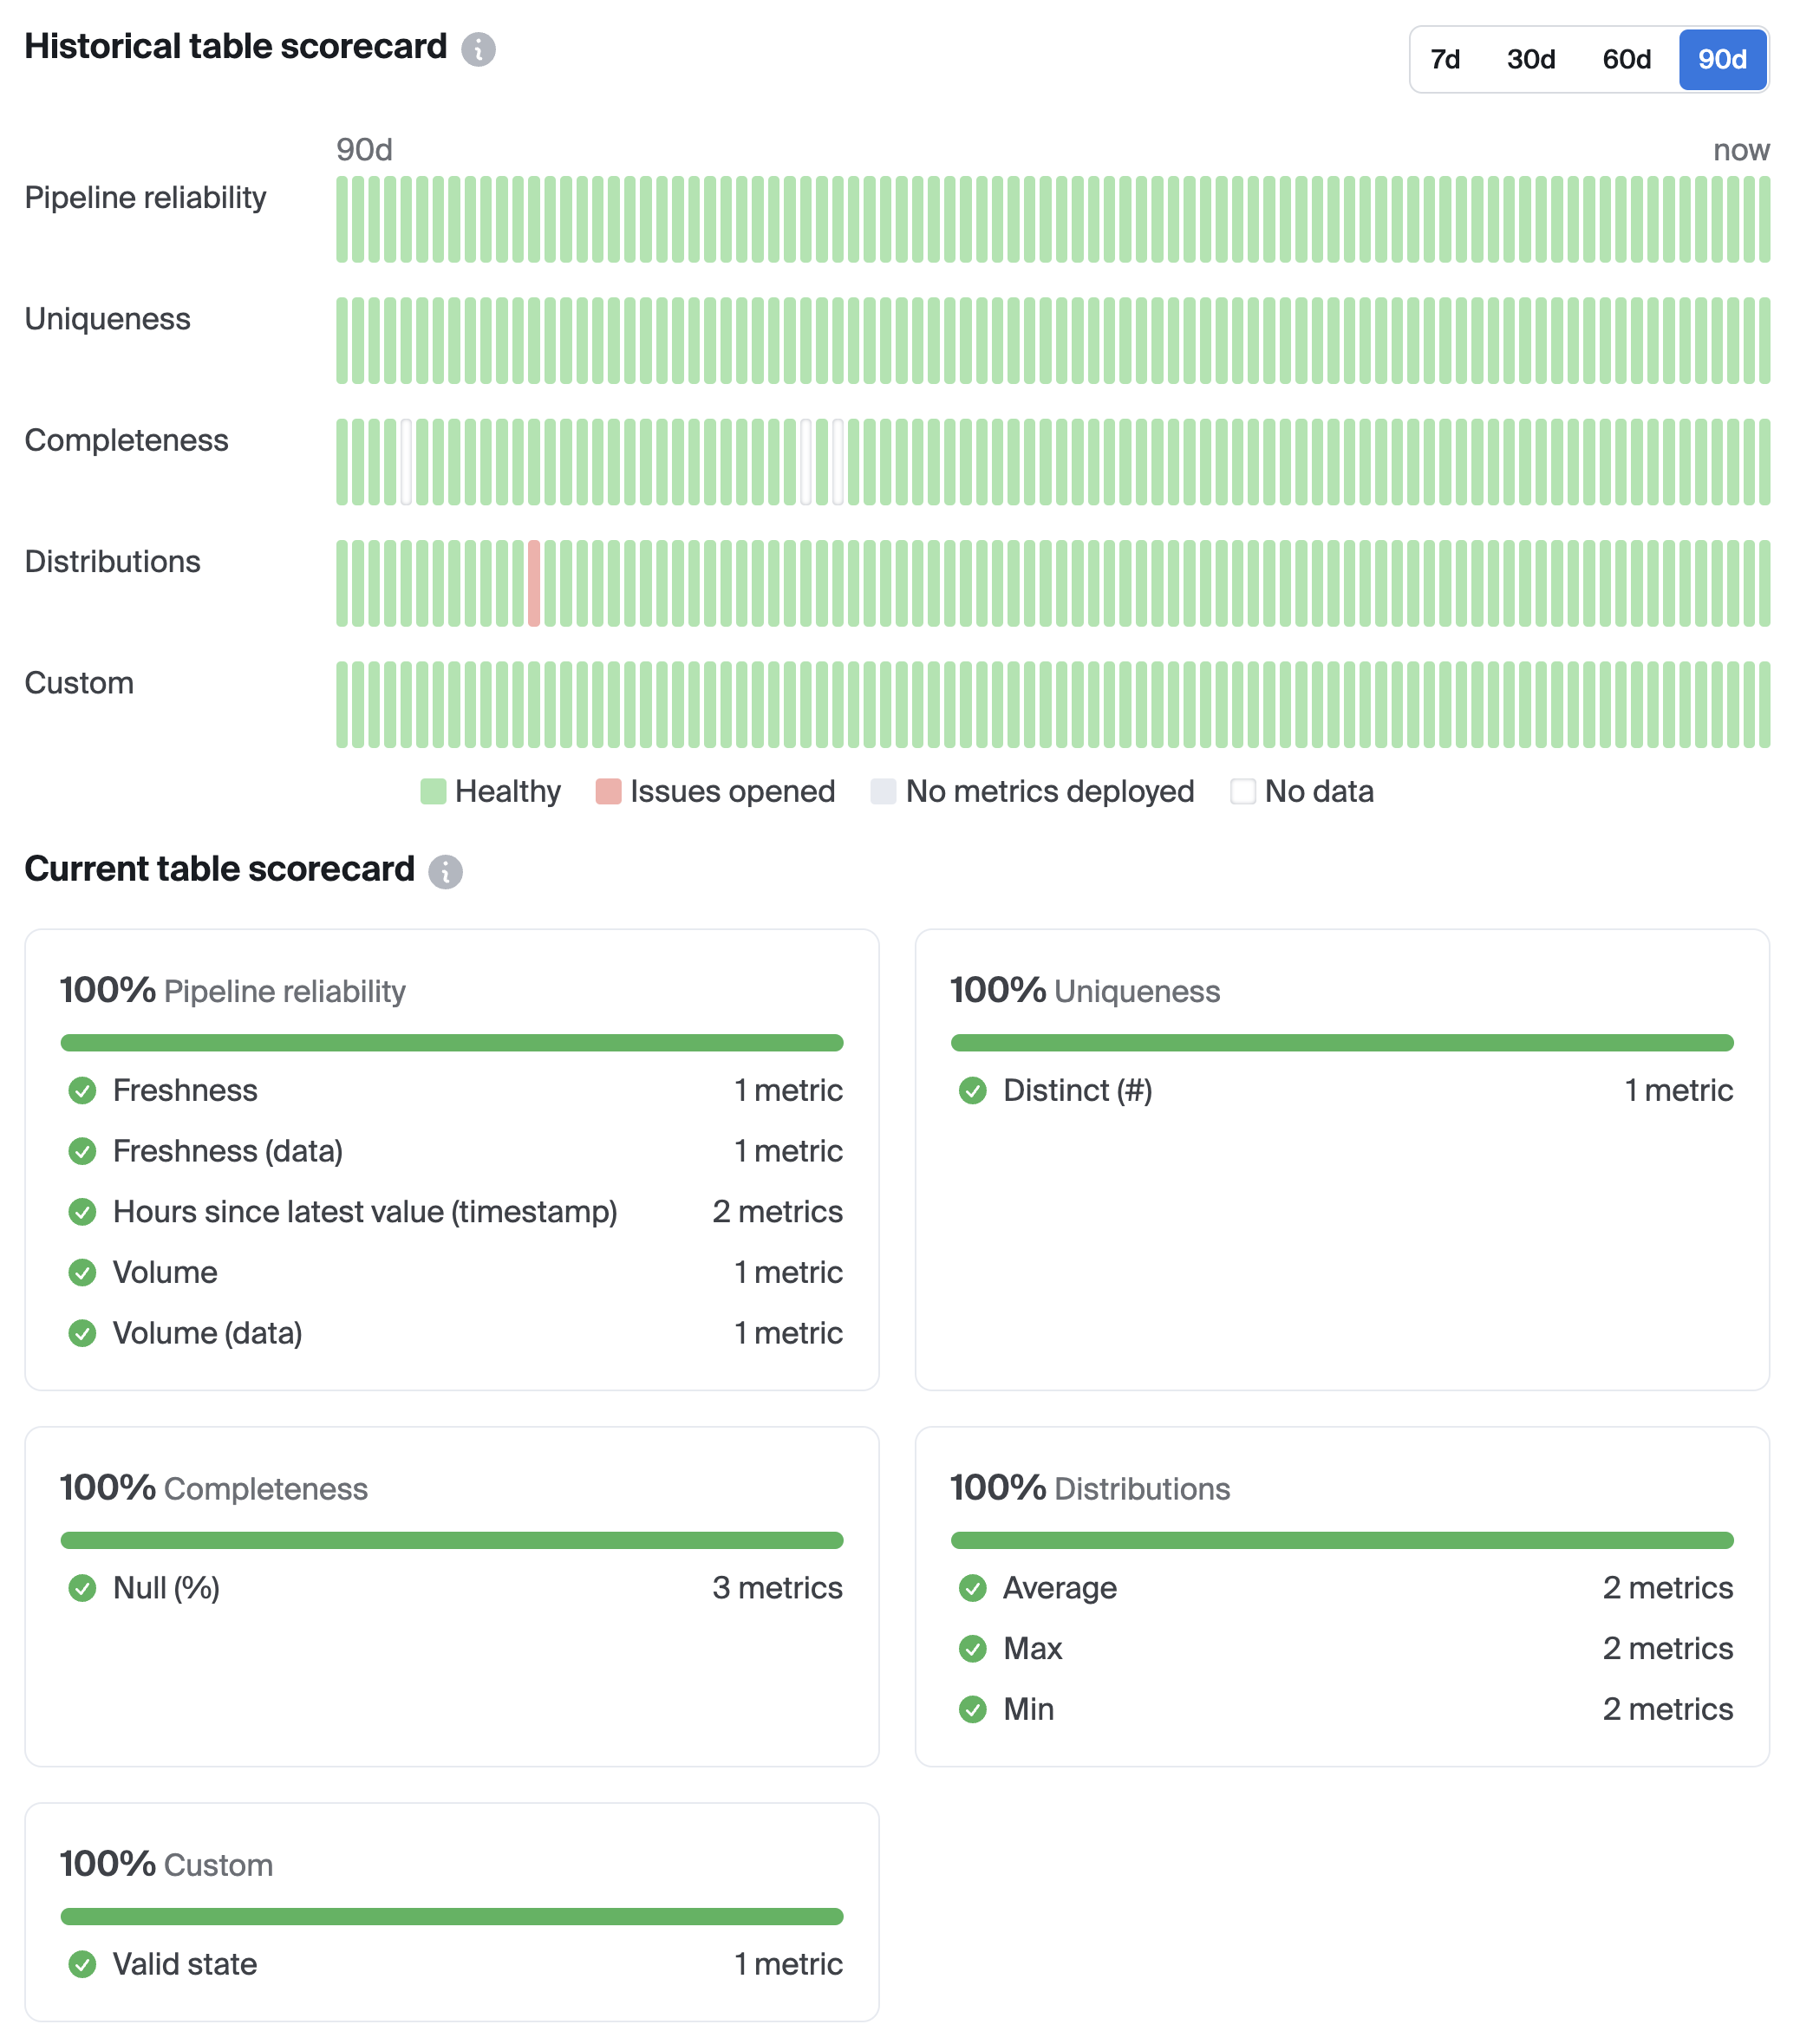
Historical Scorecard
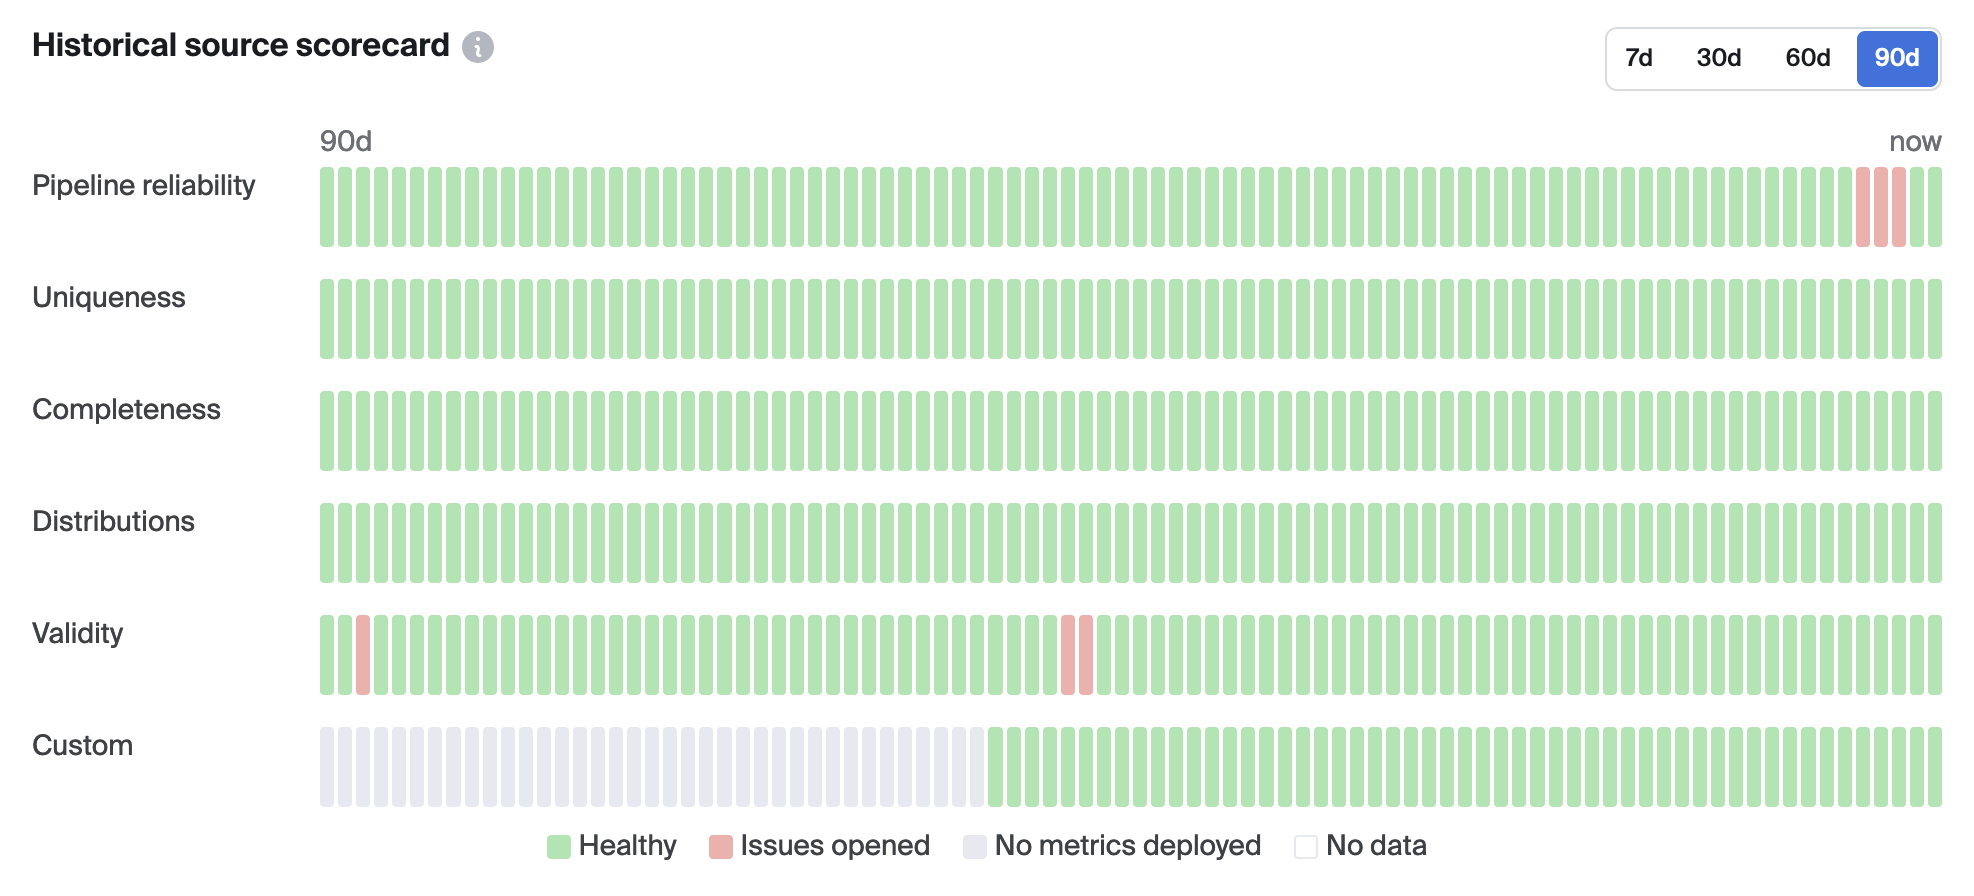
The metric history timeline has one row per data dimension. Each row has one bar per day of history, recorded in UTC time. The toggle buttons in the top right hand corner can be used to filter by different lengths of time.
Each bar is colored according to the following rules:
- Green - Healthy: On that day, there was at least one monitor deployed of that data dimension, and no true positive issues were opened. In other words, monitors were deployed and none of them had a real issue opened for them.
- Red - Issues opened: On that day, there was at least one monitor deployed of that data dimension, and at least one true positive issue was opened. In other words, monitors were deployed and at least one of them had a real issue opened.
- Grey - No metrics deployed: On that day, there were no monitors deployed of that data dimension.
Note: A "true positive" issue is defined by the following criteria:
- For metrics with Autothresholds, an issue is only considered "true positive" once labelled as such by a user. For example, an issue will be regarded as a "true positive" when closed and selecting "Anomalous."
- For metrics with manual thresholds, an issue is always considered "true positive."
Current Scorecard
This scorecard view located below the Historical Scorecard shows a snapshot of the latest state of all metrics on the selected asset.
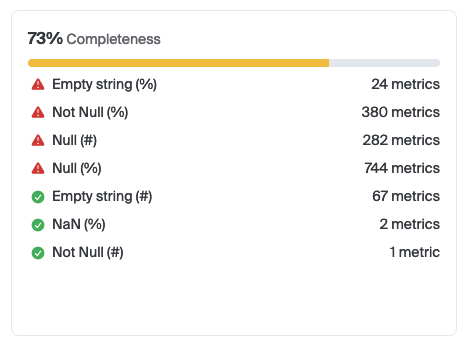
In this example image, 73% is the percentage of metrics in this dimension that are healthy. The yellow bar indicates this percentage. The bar will be red if health is under 50%, yellow if the health is between 50% and 99%, and green if there are no issues for this metric category.
Click the check or alert icons to view issues matching the metric type
Click the number of metrics to view metrics matching the metric type
Updated 8 months ago