T-shaped Monitoring: Wide-and-Deep
When rolling out a data observability platform like Bigeye, you'll need to decide which data to monitor and how. In this article, we'll look at Bigeye's recommended approach for deploying data observability across your data lake or warehouse: T-Shaped Monitoring.
If you are still deciding on a data observability strategy you must deploy from, wide-and-shallow or narrow-and-deep, then maybe you can choose to deploy a combination of both with T-Shaped Monitoring.
What is T-Shaped Monitoring?
T-shaped Monitoring tracks fundamentals across all your data while applying deeper monitoring on the most critical datasets, such as those used for financial planning, machine learning models, and executive-level dashboards. This approach ensures you're covered against even the unknown unknowns.
Like the wide-and-shallow strategy, which enables essential monitoring for a few key attributes on most or all of your datasets, the T-shaped monitoring approach keeps a check on all your data. It uses deployment like narrow-and-deep to focus on the critical group of tables with as many data quality attributes as possible when required. This strategy can include monitoring for characteristics like null or missing fields.
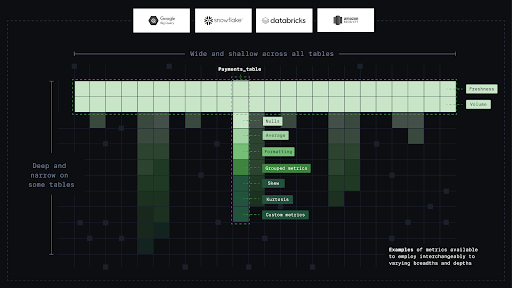
Below, we cover how to implement T-shaped monitoring on your datasets.
First, Go Wide
Metadata Metrics
Use metadata metrics to provide customers with the "wide" part of the T-shaped strategy.
What kinds of metrics are metadata metrics?
Metadata metrics are vital operational metrics that provide instant coverage for the entire data warehouse from the time you connect. It scans your existing query logs to automatically track key operational metrics, including hours since the last table load, rows inserted, and the number of read queries on every dataset.
Metric Name | API Name | Description |
|---|---|---|
Hours since last load | HOURS_SINCE_LAST_LOAD | The number of hours since an INSERT, COPY, or MERGE was performed on a table. It is suggested as an autometric once per table. |
Rows inserted | ROWS_INSERTED | The number of rows added to the table via INSERT, COPY, or MERGE statements in the past 24 hours. It is suggested as an autometric once per table. |
Read queries | COUNT_READ_QUERIES | The number of SELECT queries issued on a table in the past 24 hours. It is suggested as an autometric once per table. |
Note: Metadata Metrics can't be applied on database views.
How do I deploy Metadata metrics?
Metadata metrics are available on Snowflake, BigQuery, and Redshift sources. To enable metadata metrics on all tables in that source:
- From the Catalog page, click Add source.
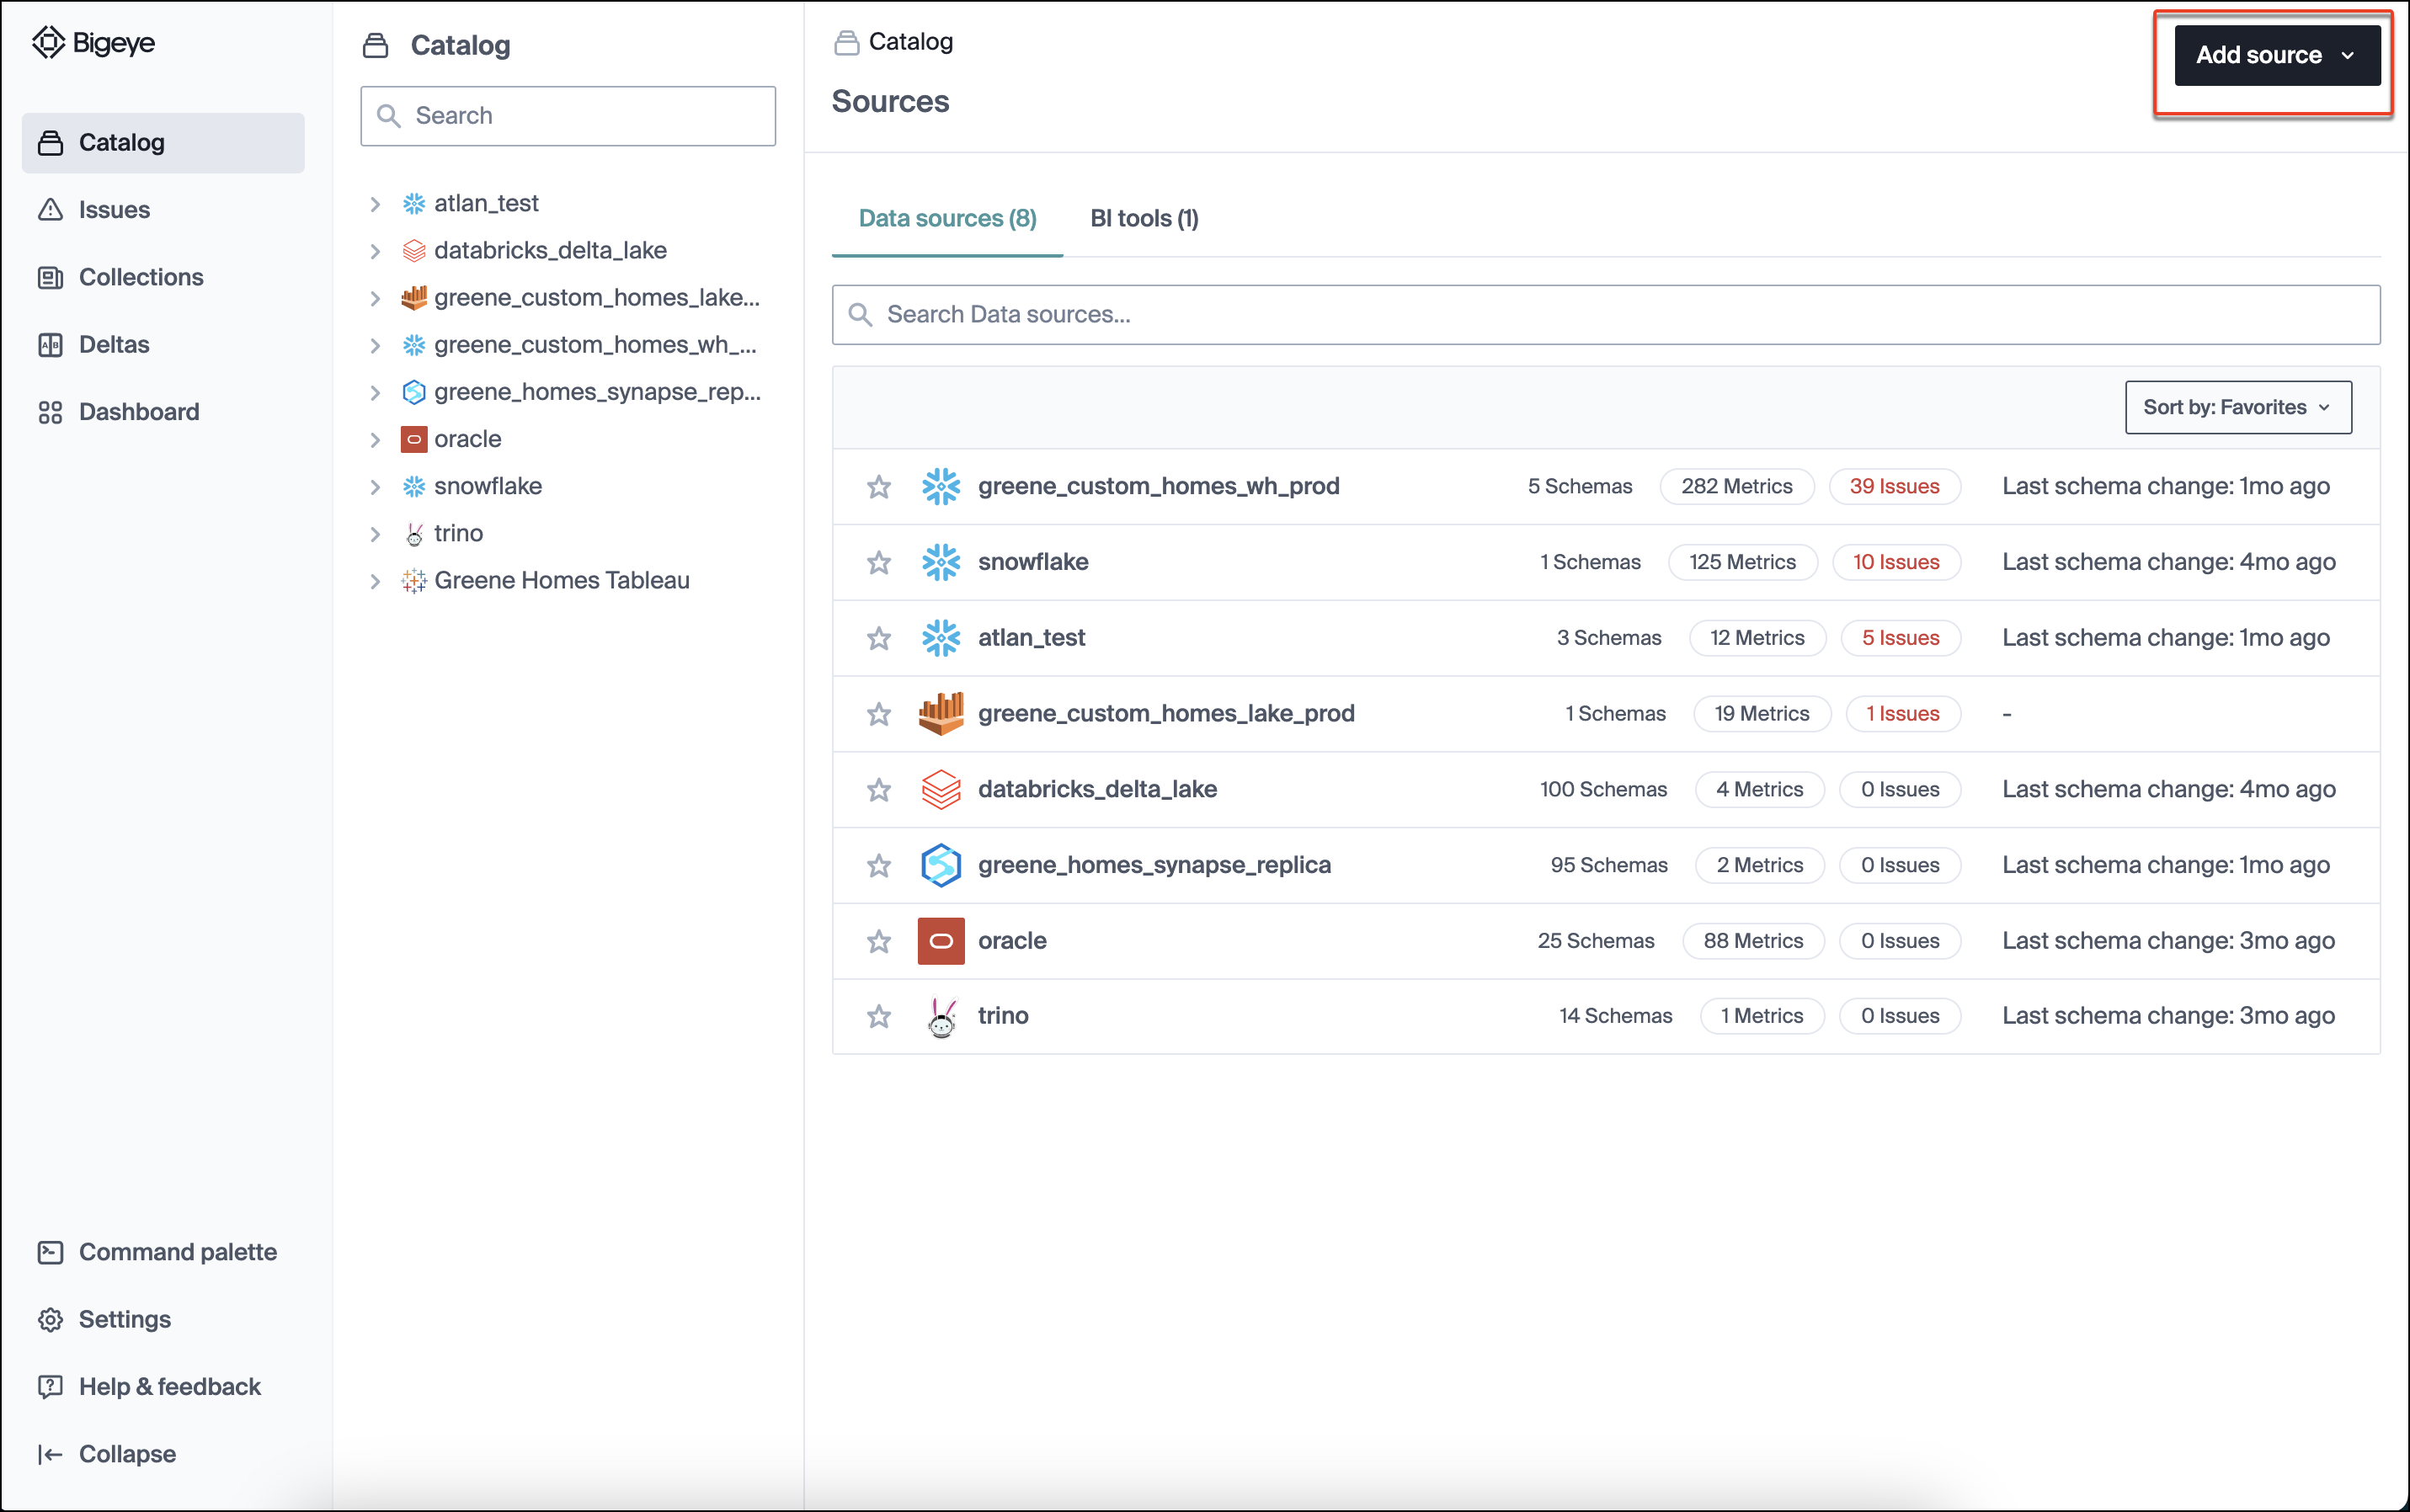
- On the modal that appears, select the source.
You can find instructions to connect and configure each source type under Data Sources.
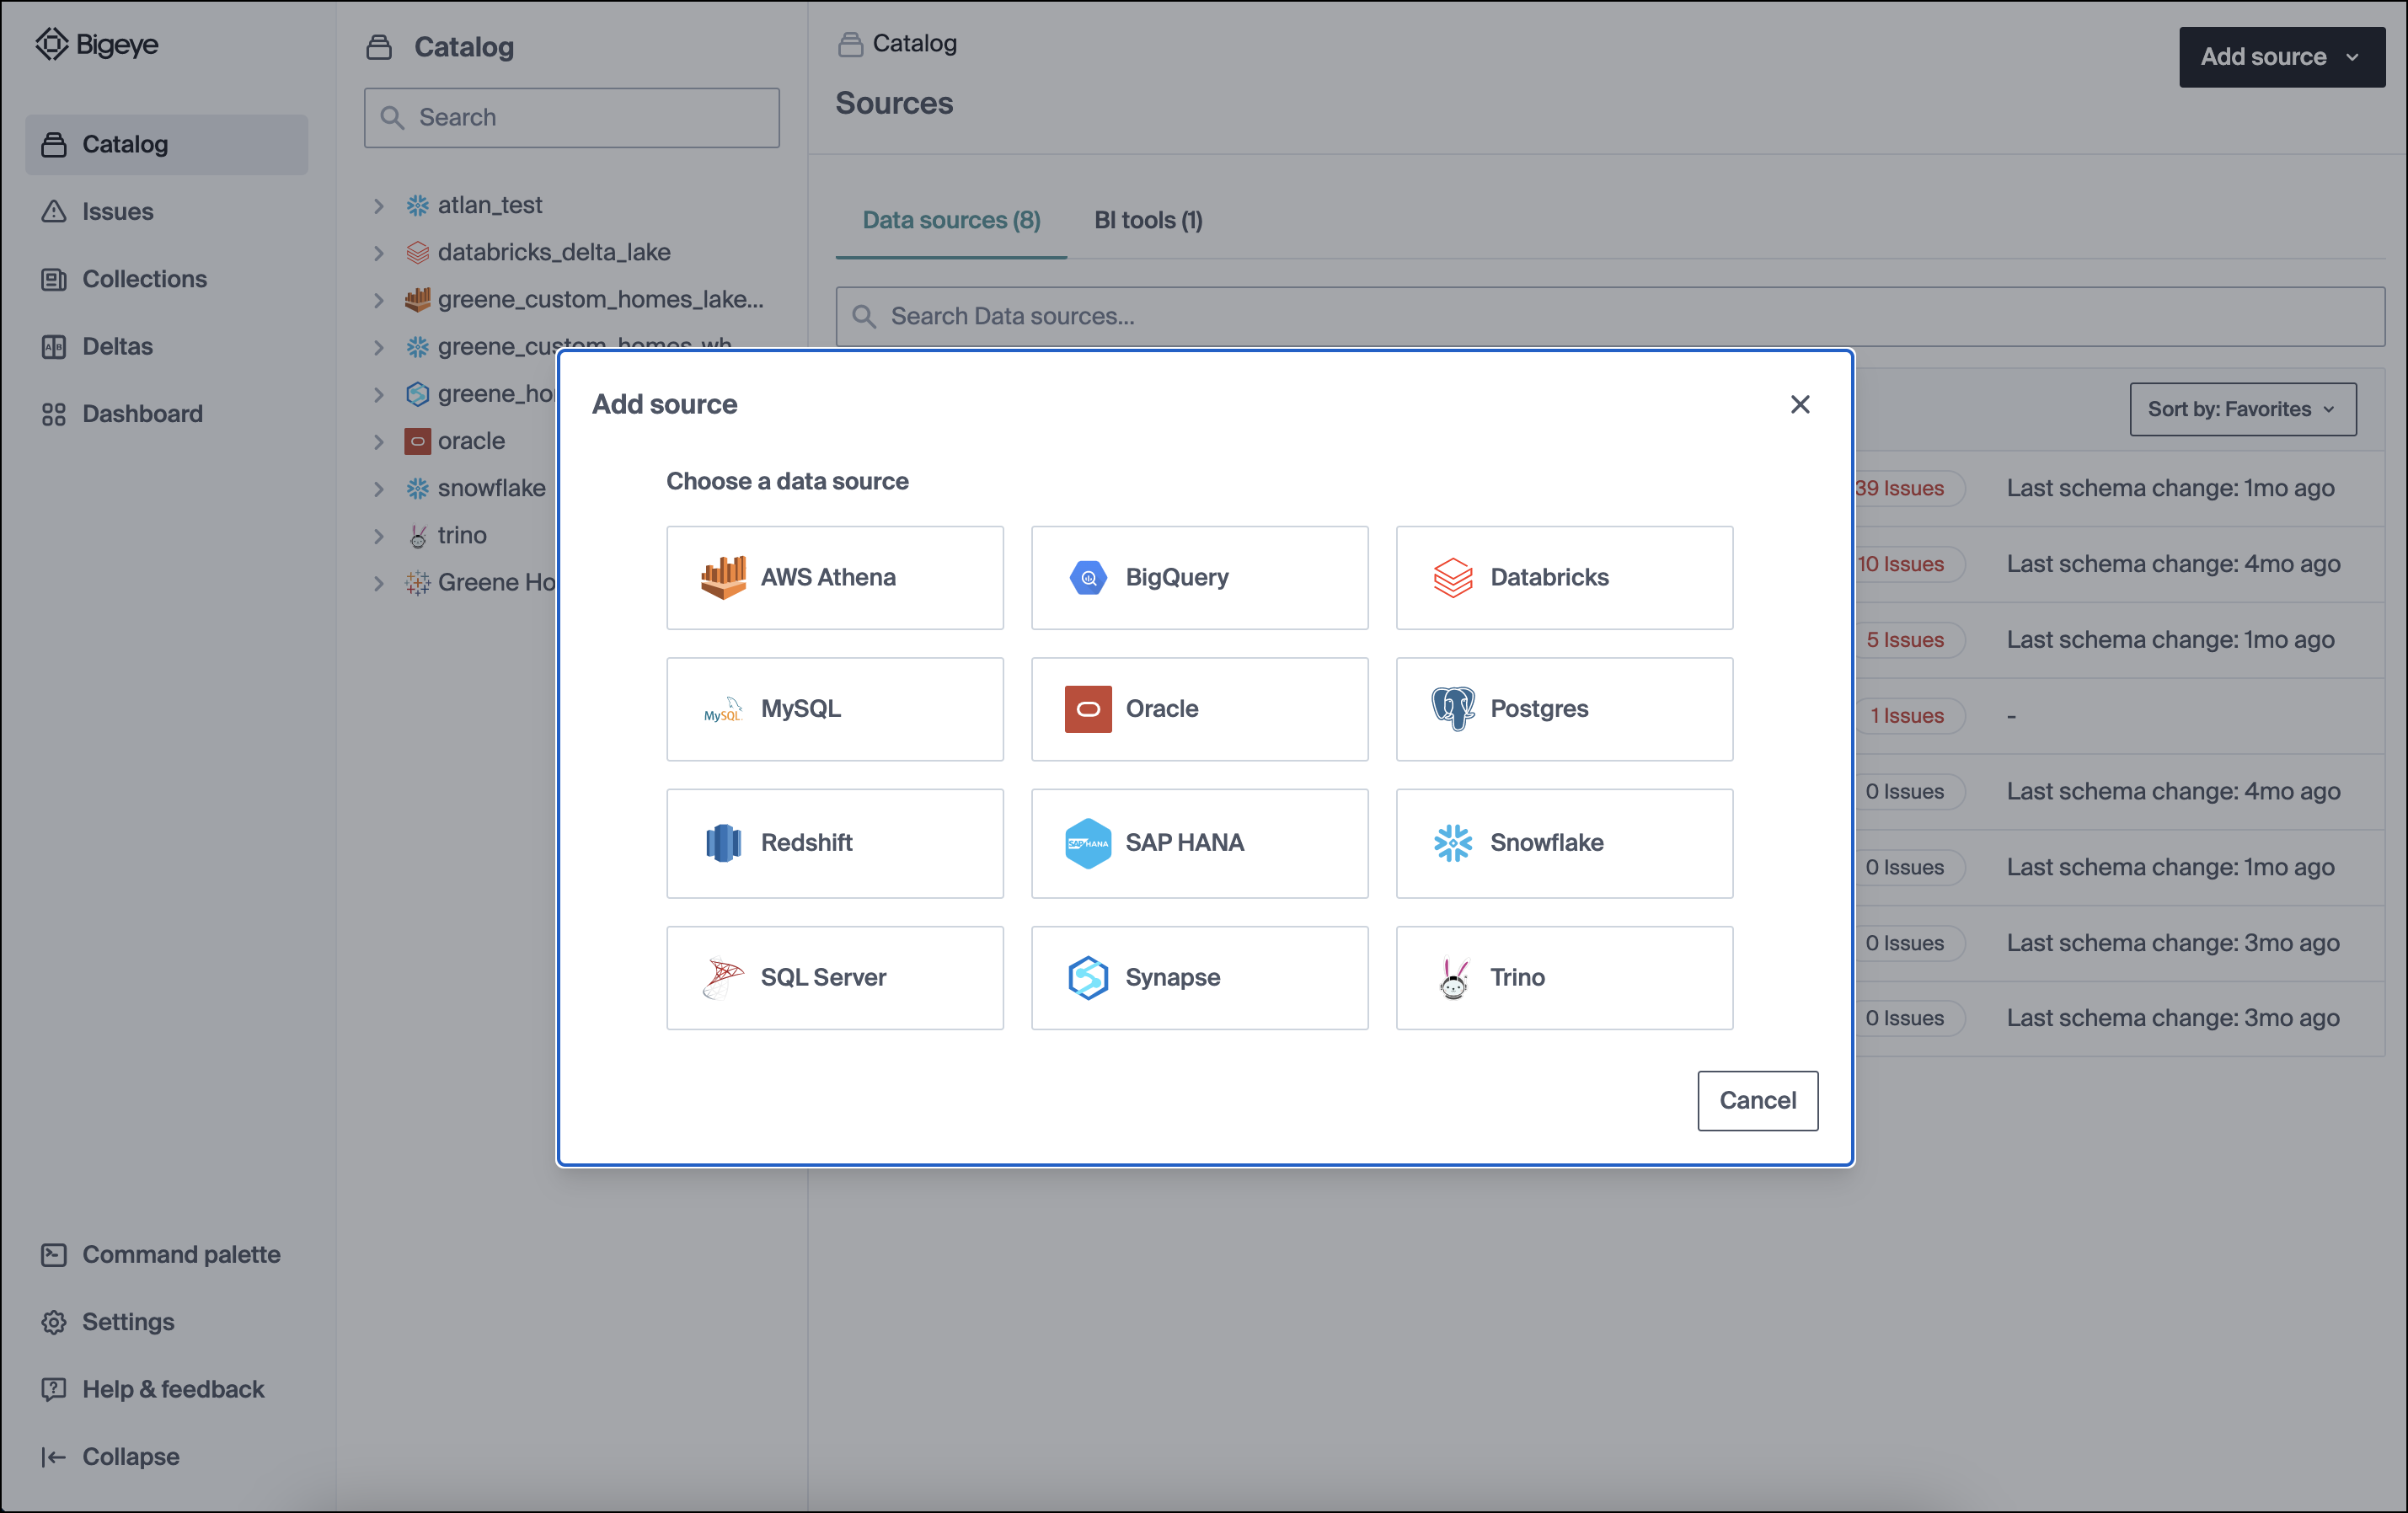
- Input the connection details and click Validate source.
Note: For demonstration, we have selected a Snowflake source.
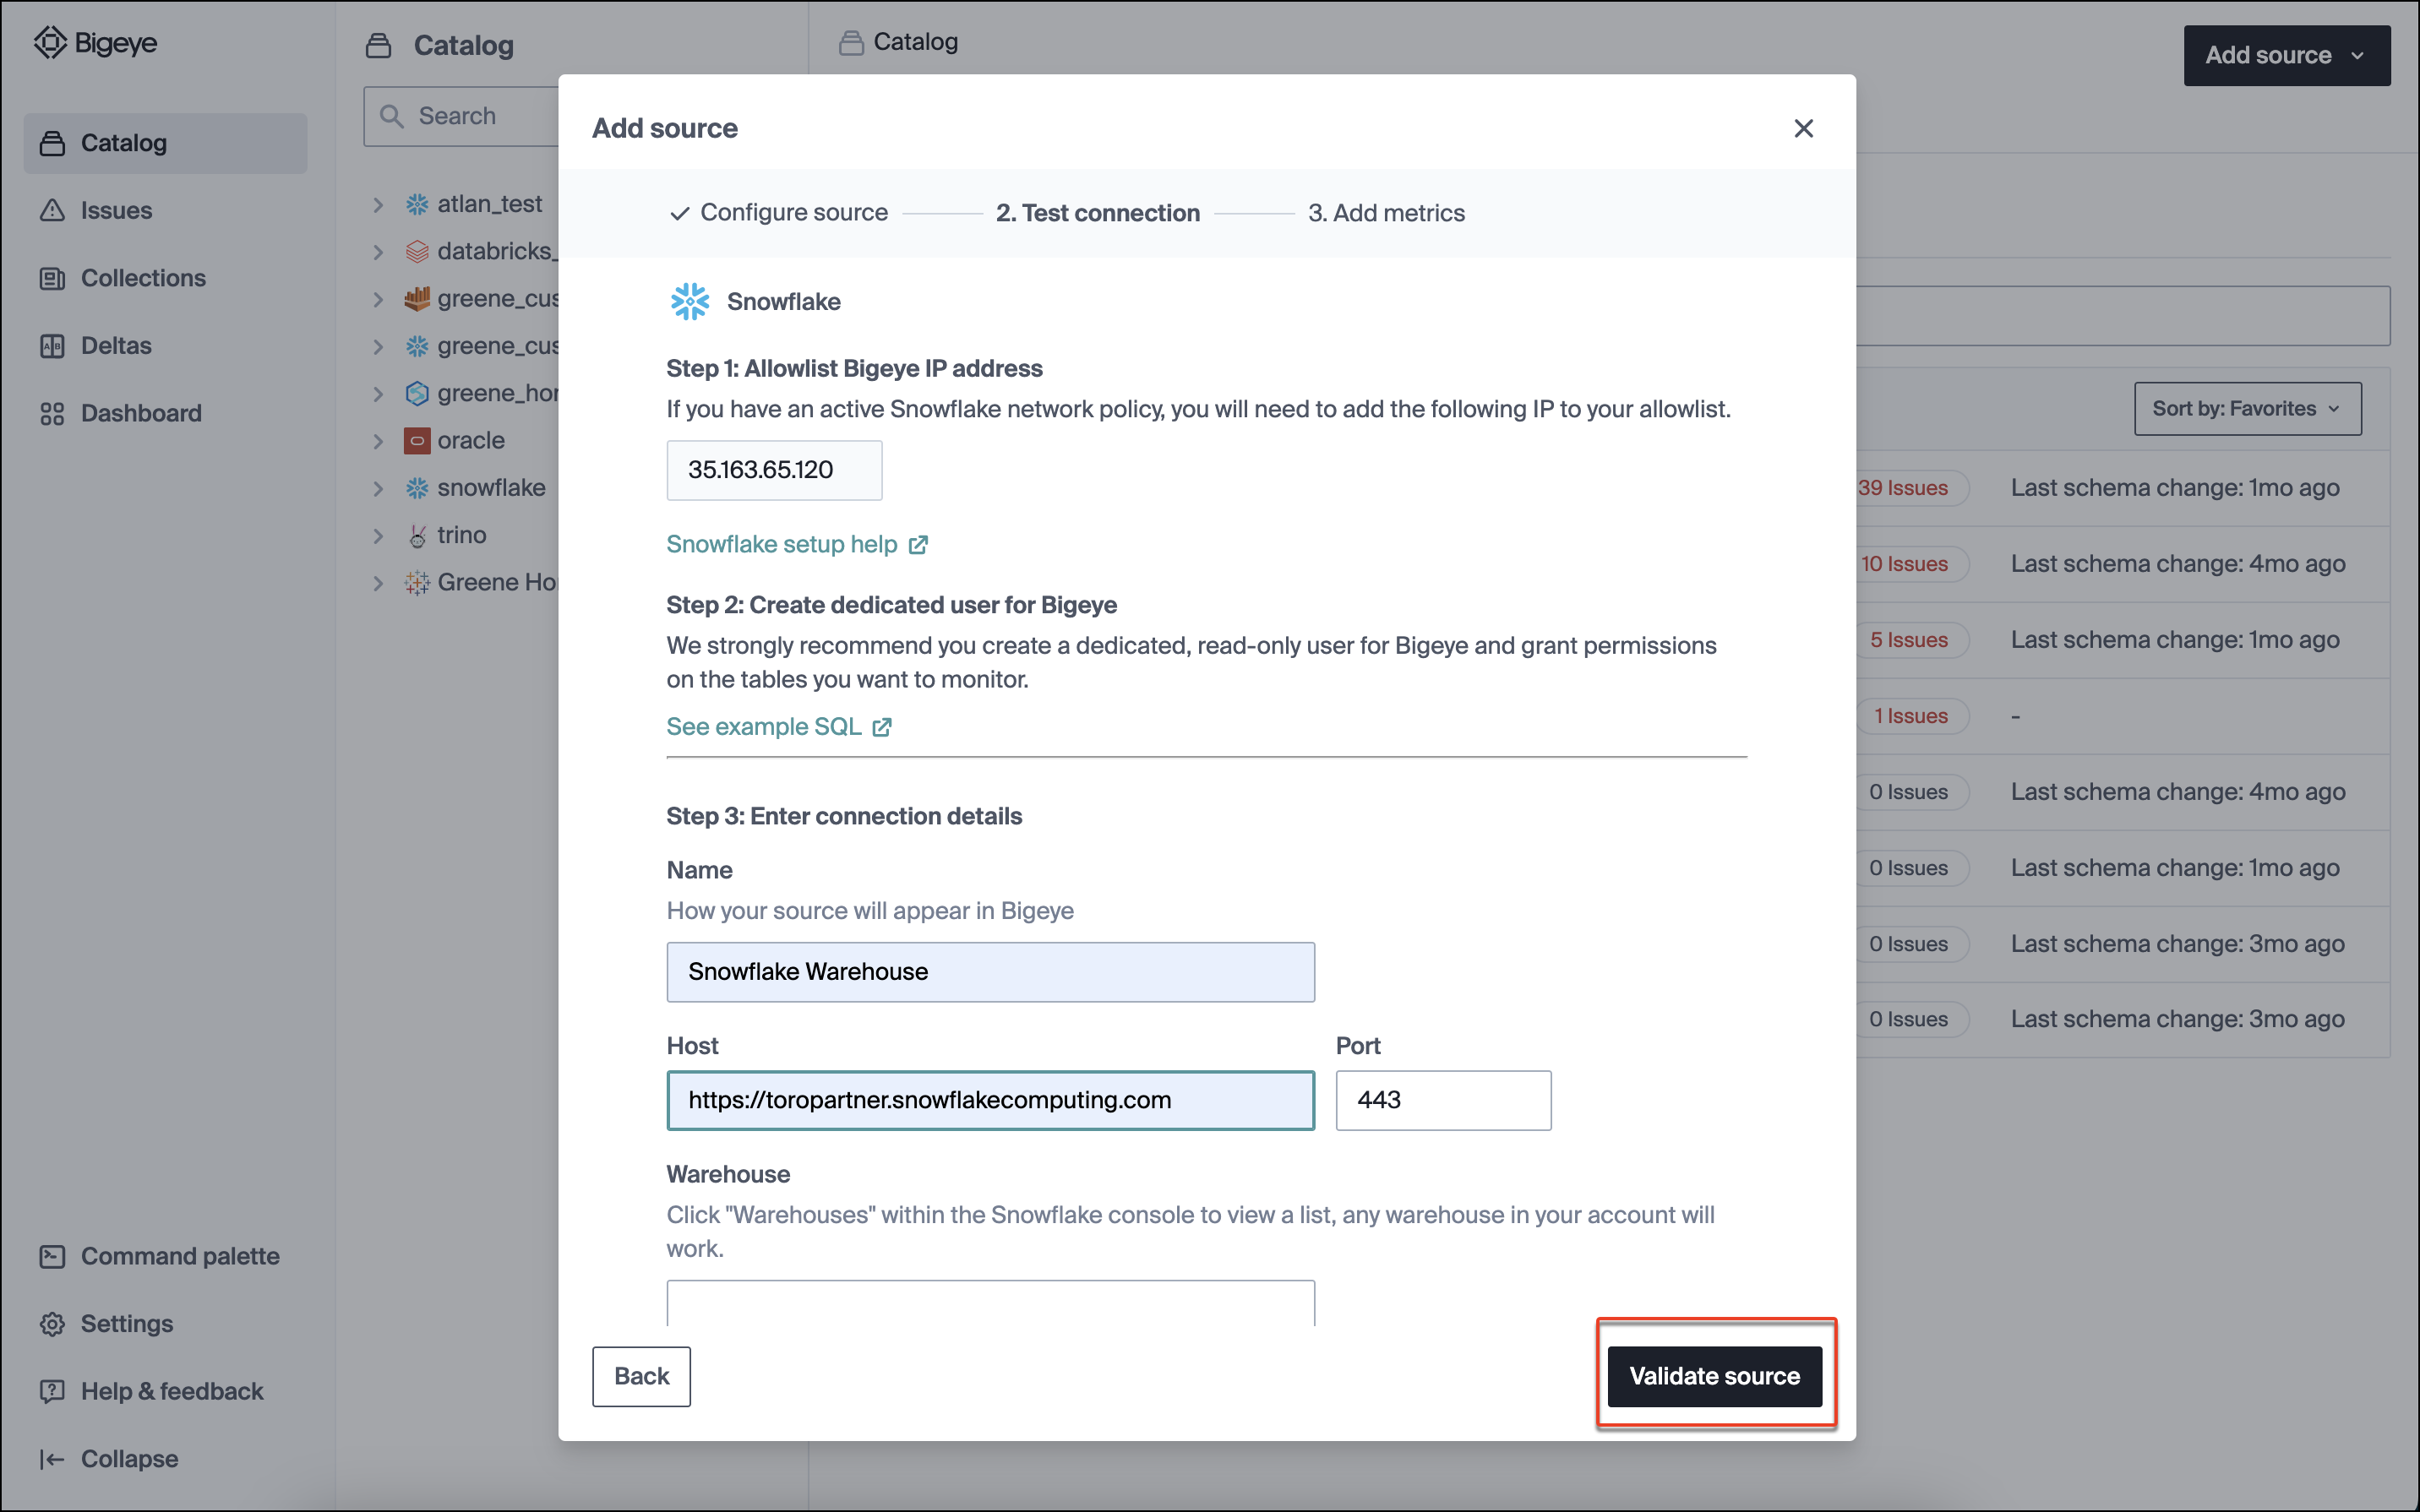
- Test connection: This step will query your warehouse to ensure that the user you provided has the permissions necessary to read data and run all Bigeye metric types. If an error is returned, ensure the service account is permissioned correctly per the above instructions.
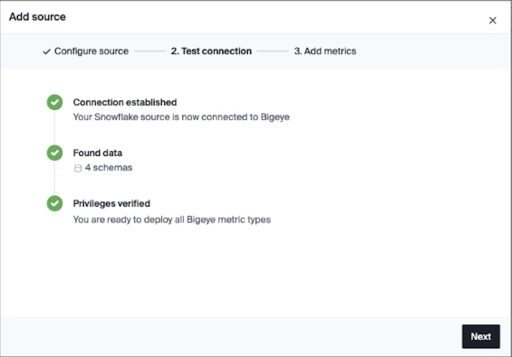
- Add metrics: If the test connection succeeds, you can deploy Metadata Metrics on your schemas. We recommend broad coverage of these metrics across your warehouse to detect the most common data quality issues.
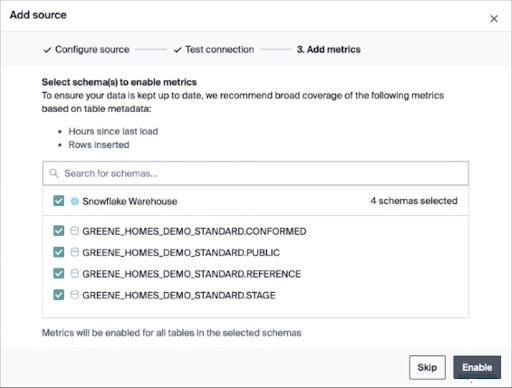
Note that Metadata metrics offer:
- Instant setup
- No manual configuration
- Negligible additional load to your warehouse
- 24*7 extensive monitoring
Second, Go Deep
Now that you have metadata metrics on all your tables, you can drill down into key tables and enable more fine-grained monitoring.
Go deep on each business-critical dataset using a blend of metrics that Bigeye suggests for each table from its library of 70+ pre-built data quality metrics, including metrics like freshness, volume, nulls, and blanks, outliers, distributions, and formatting.
Deep monitoring works best in use cases where key data applications like executive dashboards and production machine learning models need to be kept defect-free. A few example use cases are:
- Making sure high-priority analytics dashboards are fed with high-quality data.
- Keeping training datasets for in-production ML models safe.
- Ensuring data being sent or sold to partners or customers is defect-free and within any contractual SLAs.
You can also add custom metrics with Templates and Virtual Tables to monitor business rules and check for defects.
Updated 8 months ago
