
Getting Started
Start creating monitoring AI agents and data quality across your enterprise data landscape.
Overview
- Connect to your AI platform(s)
- View AI agent usage and insights
- Connect to your data source(s)
- Deploy monitoring for data sources
- View agent data access
1. Setup - Connect to your first AI platform and invite users
When you first log in to Bigeye, you will be presented with a video overview, and then go into the setup checklist.
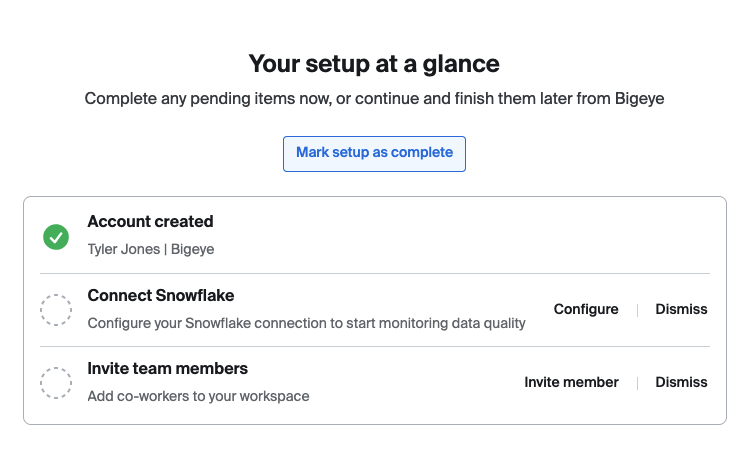
This checklist will aid you while getting started with Bigeye.
Connecting an AI Platform such as Snowflake Intelligence will allow Bigeye to show you discovered agents, conversations, and give insights about cost and data access. If you connect a data source, Bigeye will link your AI conversations to the tables accessed in those conversations.
- To connect your AI platforms, see Setup AI Platform Connection
- Learn more about managing users
- Learn more about the Setup page
2. View AI agent usage and insights
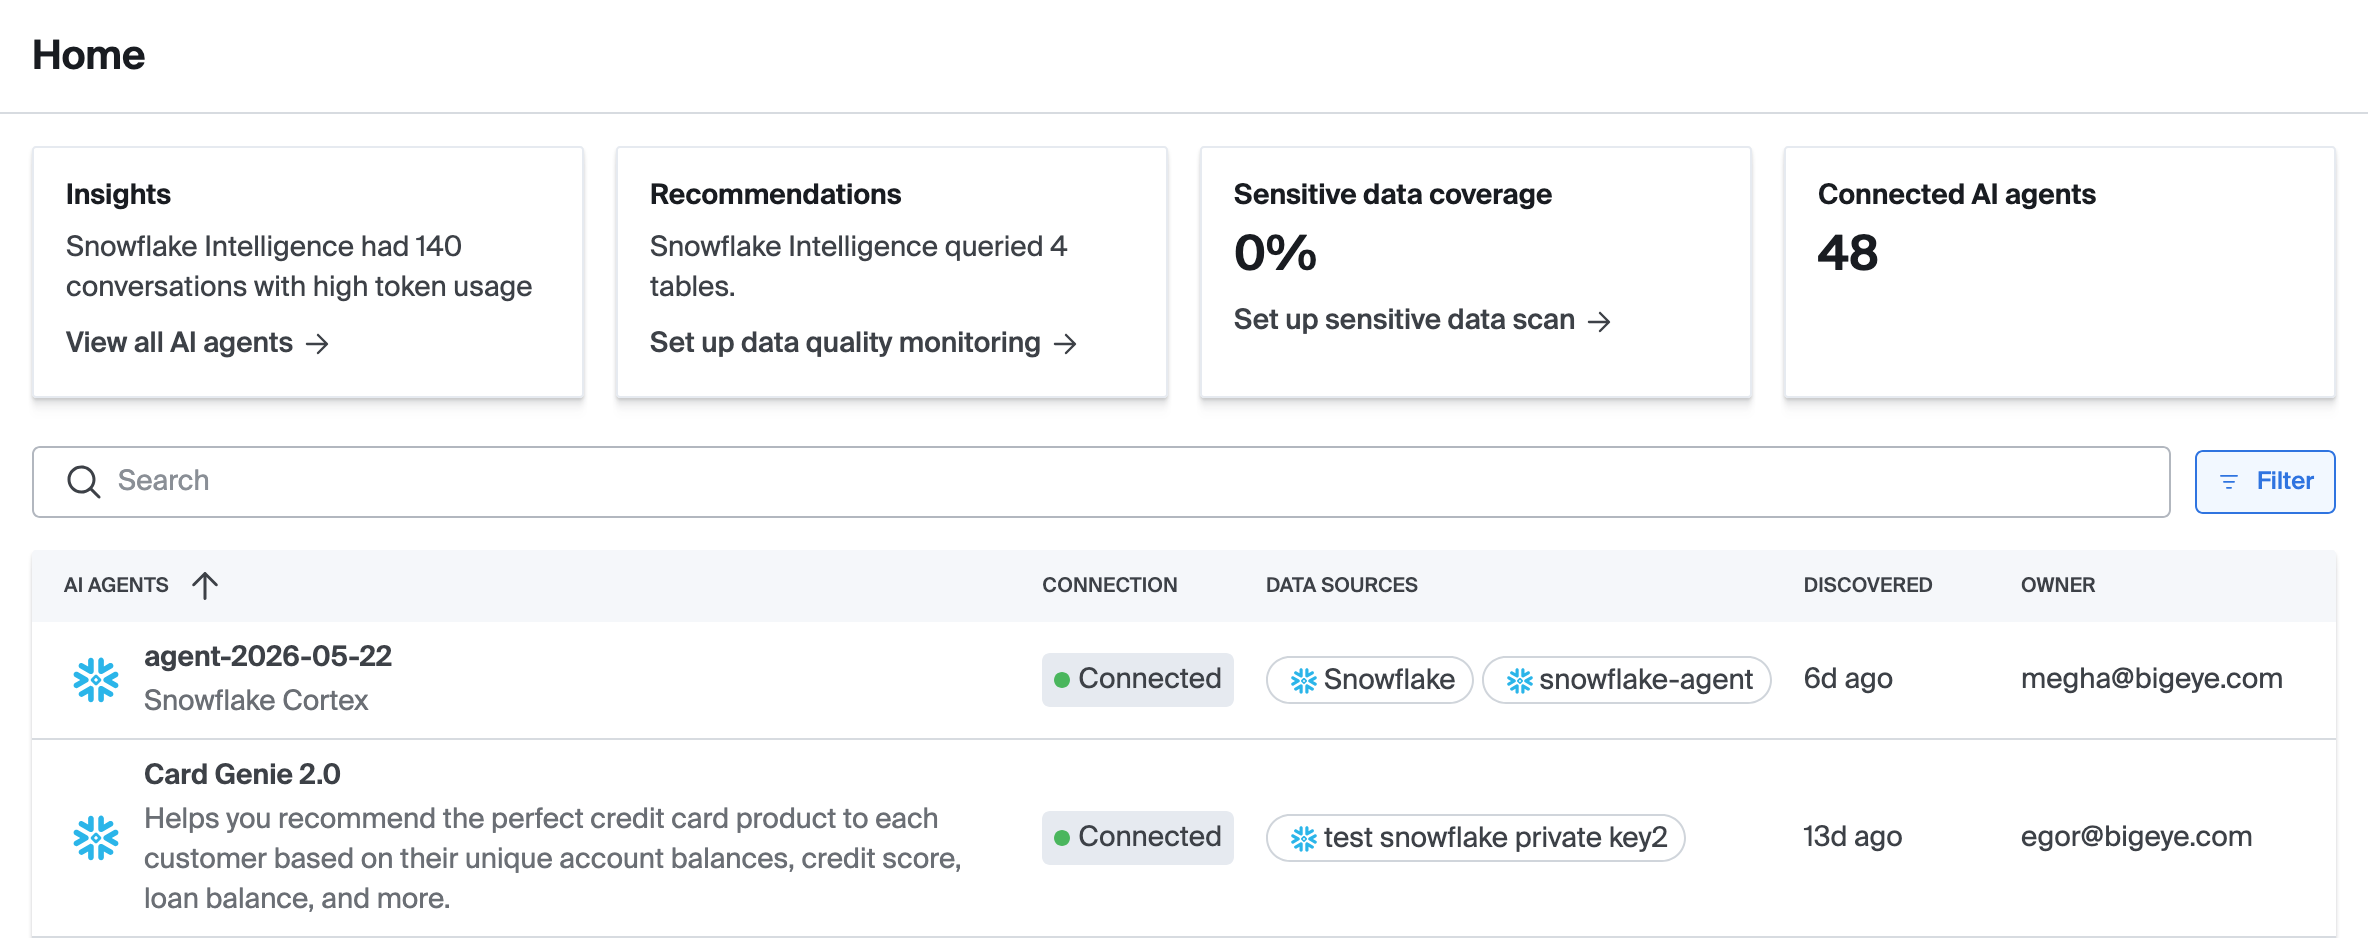
Once you have connected an AI platform, you should be able to view discovered agents and insights.
- More about Home page
- Learn about insights that Bigeye finds
3. Connect your data source(s)
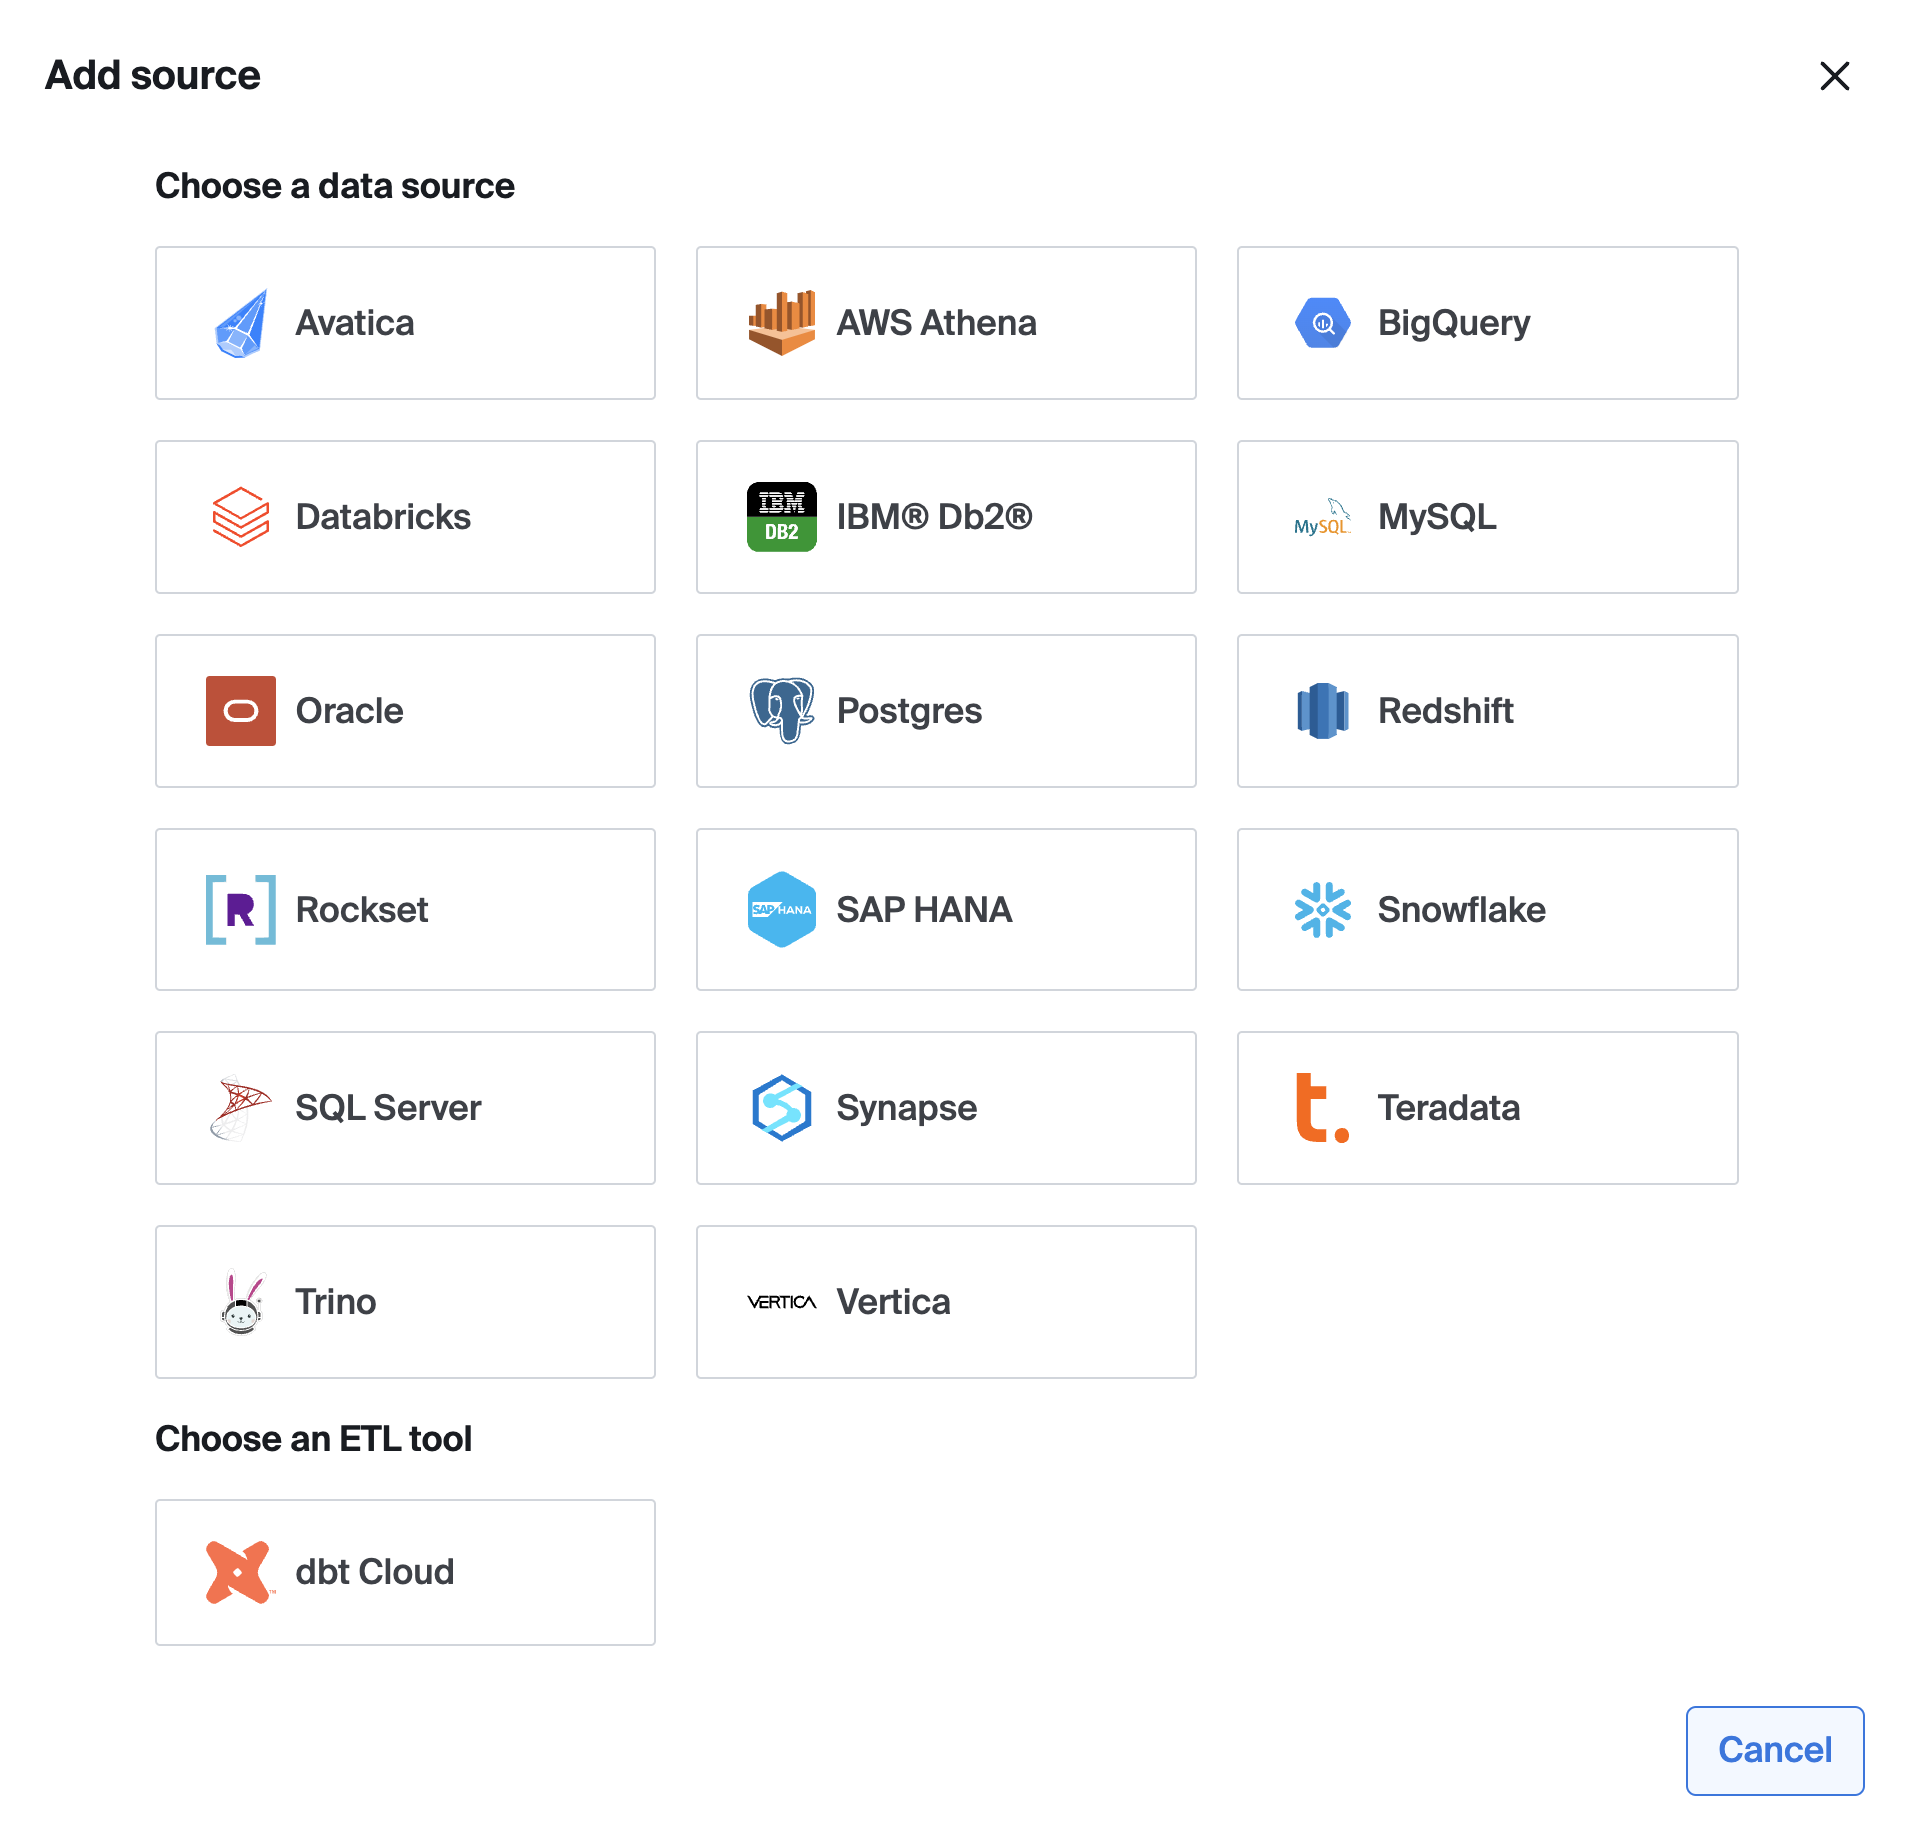
For information on how to connect your data sources, see Setup Data Source Connection.
You can find our supported sources and instructions to connect each type under Data Sources. In general, we recommend creating a new service account and provisioning it only with the required permissions for the data you wish to monitor with Bigeye. To add a new source, go to Catalog > Add source. Note only admin users will be able to add new sources. Not all sources are available for trial accounts.
Once your source is connected, Bigeye will automatically profile your data in order to recommend Autometrics, or suggested metrics to ensure your data is consistently accurate and reliable. To learn more about the heuristics used to recommend Autometrics, see Available Metrics.
4. Deploy Monitoring
Autometrics are suggested metrics that monitor anomalies in your data. Autometrics are automatically generated for all new datasets added to Bigeye. You can find Autometrics in the Catalog when viewing a source, schema, table or column page—or on the Lineage page once you've selected a target table, column, or schema.
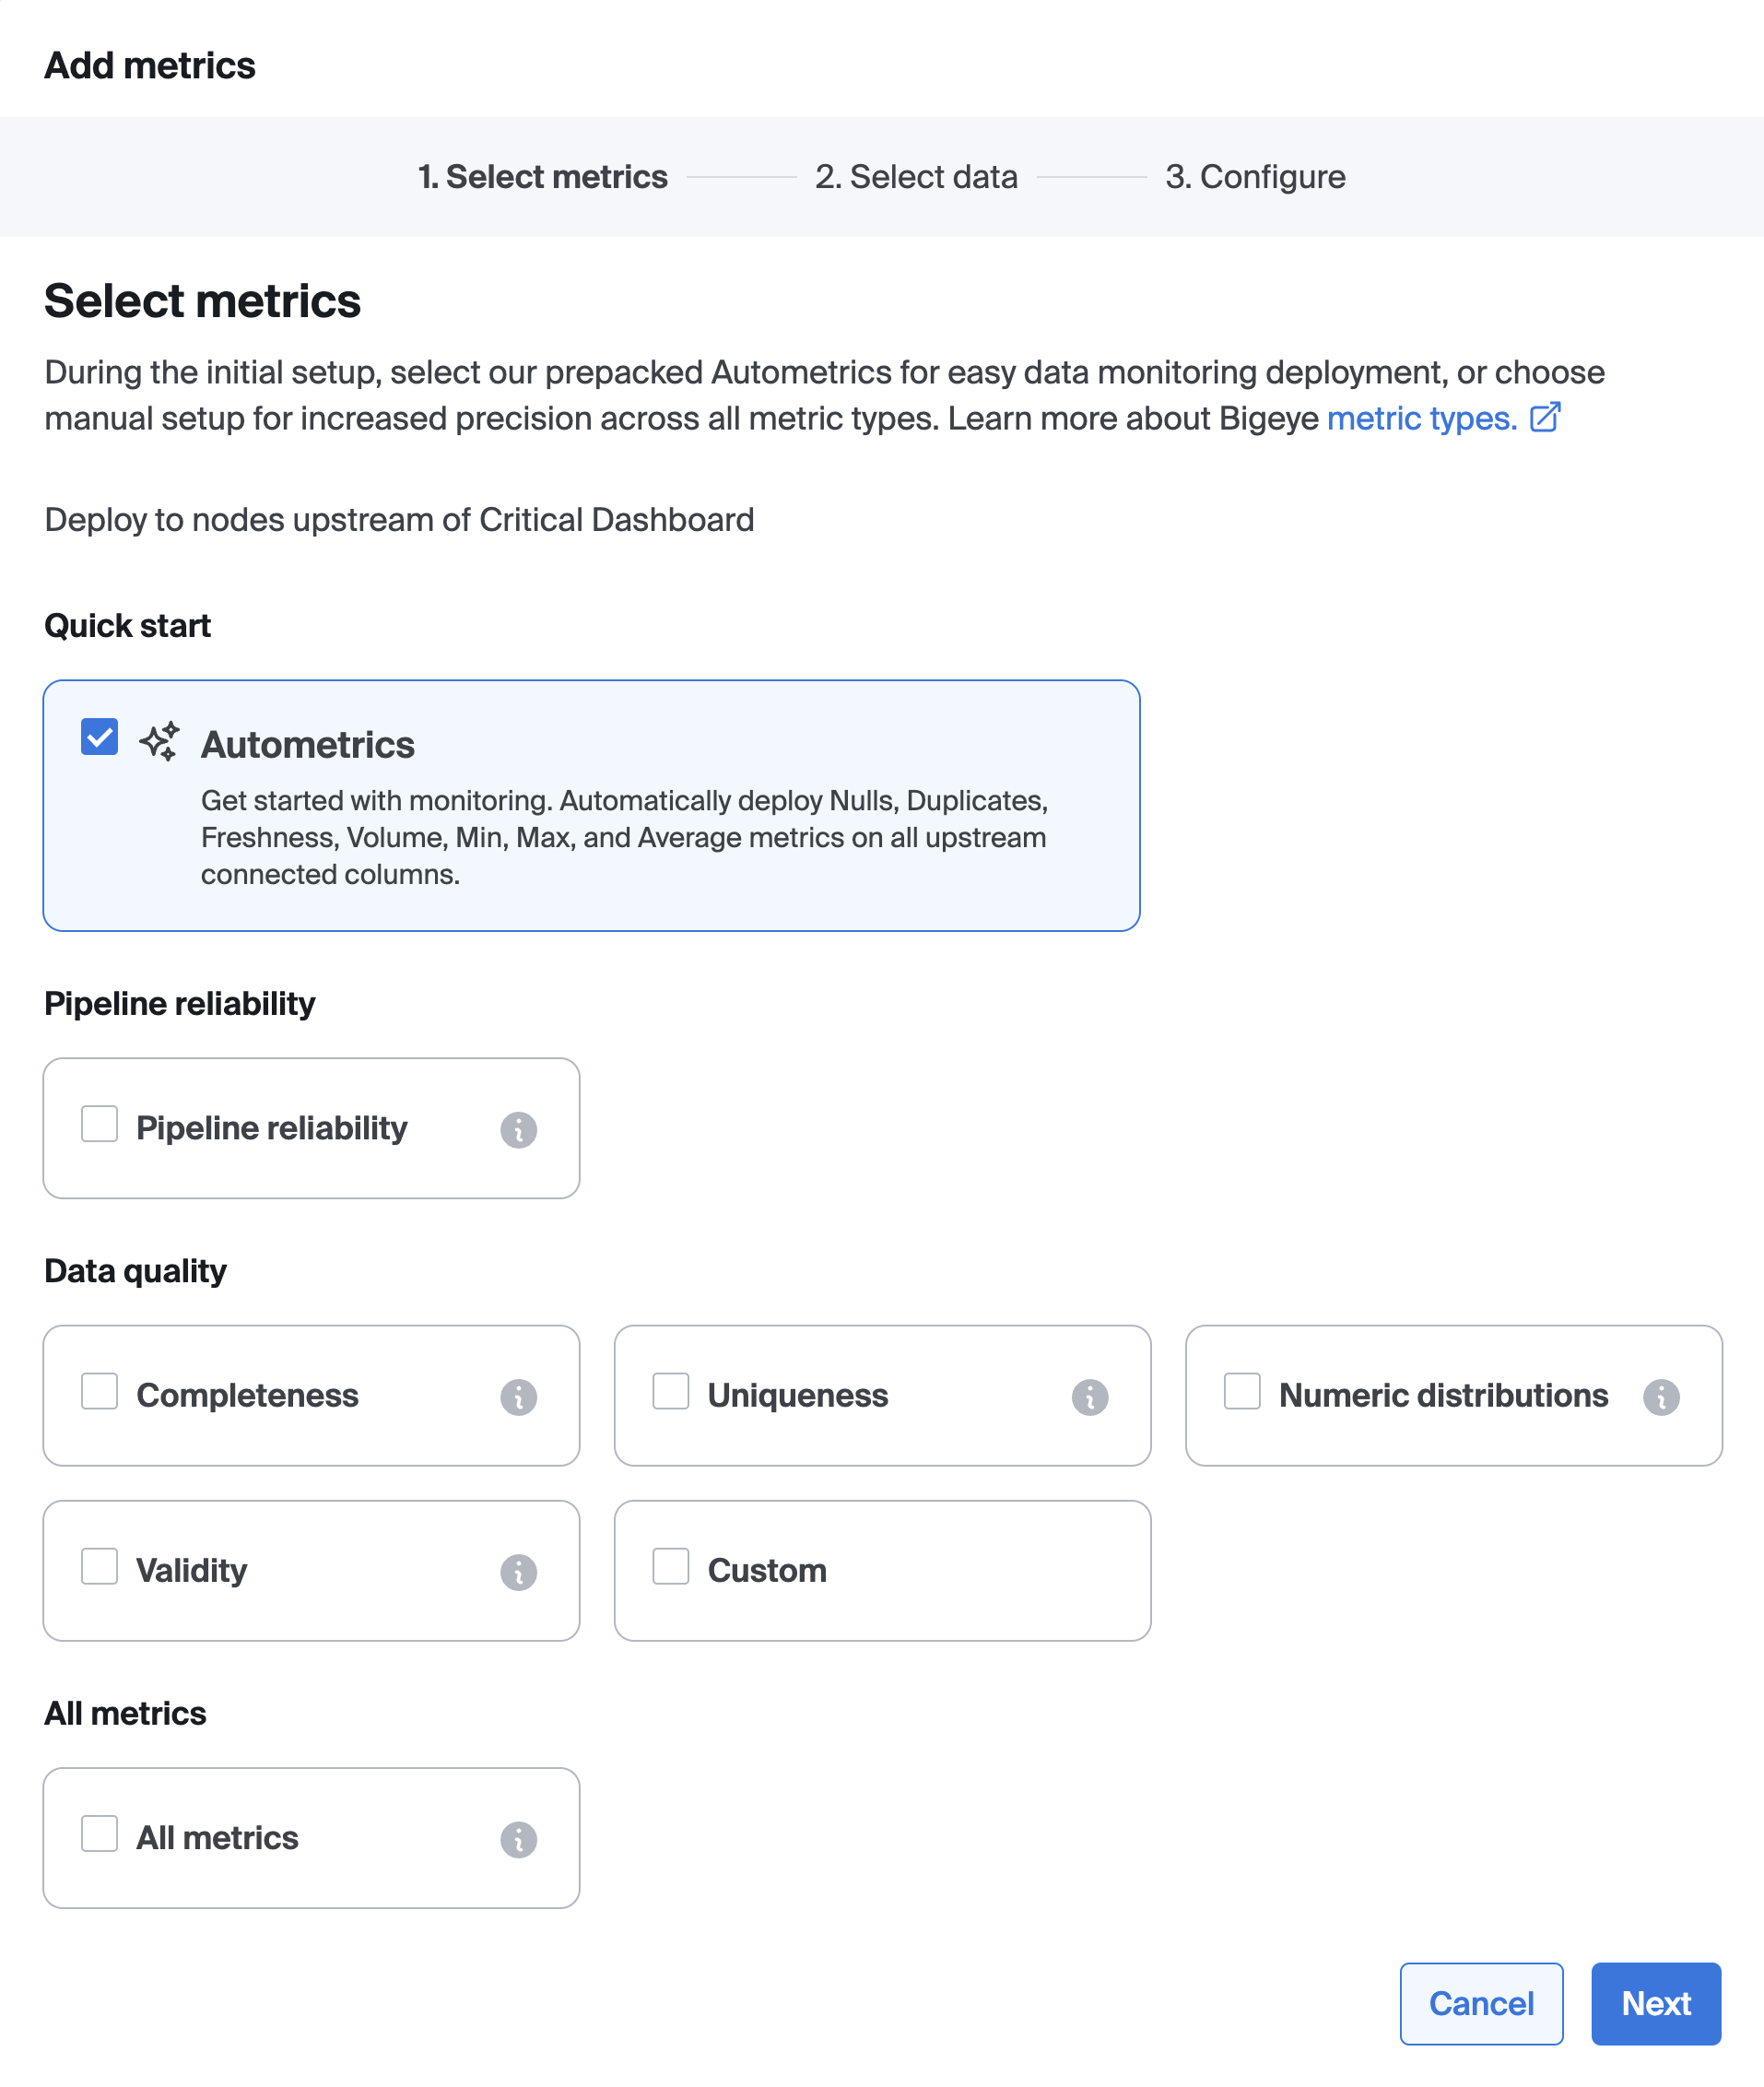
You can search, or use filters, to find metrics relevant to your monitoring goals. Select the relevant Autometrics, and click “enable”. By default, Bigeye metrics use Autothresholds to detect anomalies in your data and send alerts, so there’s no need to manually define thresholds. You have the option to configure metrics by setting a row creation time. Once a table's row creation time is set, Bigeye backfills metric history and enables Autothresholds without a training period.
5. View agent data access
Once you have an AI platform connected and an indexed Data Source, you may view information about table accesses that includes data quality.
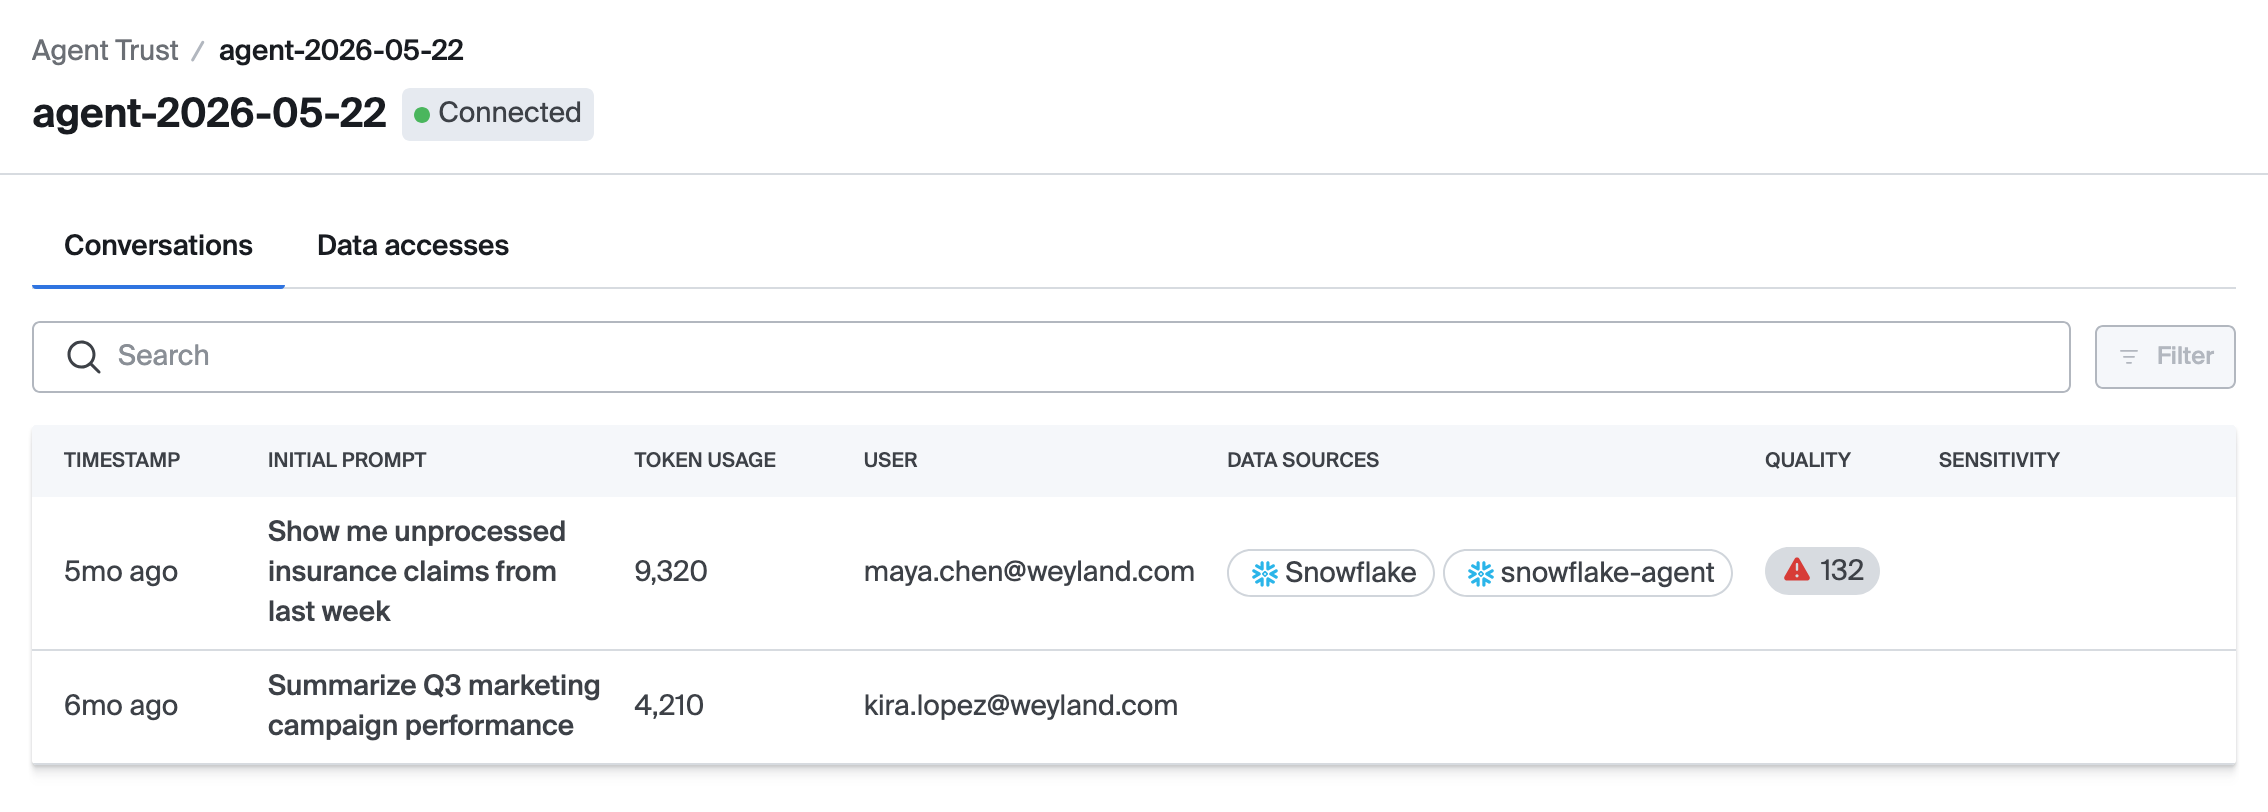
From the home page, select an agent to view conversations for it.
The conversations list will show a list of conversations with a hint of the data quality issues associated with each item. Click on a conversation to view details about it
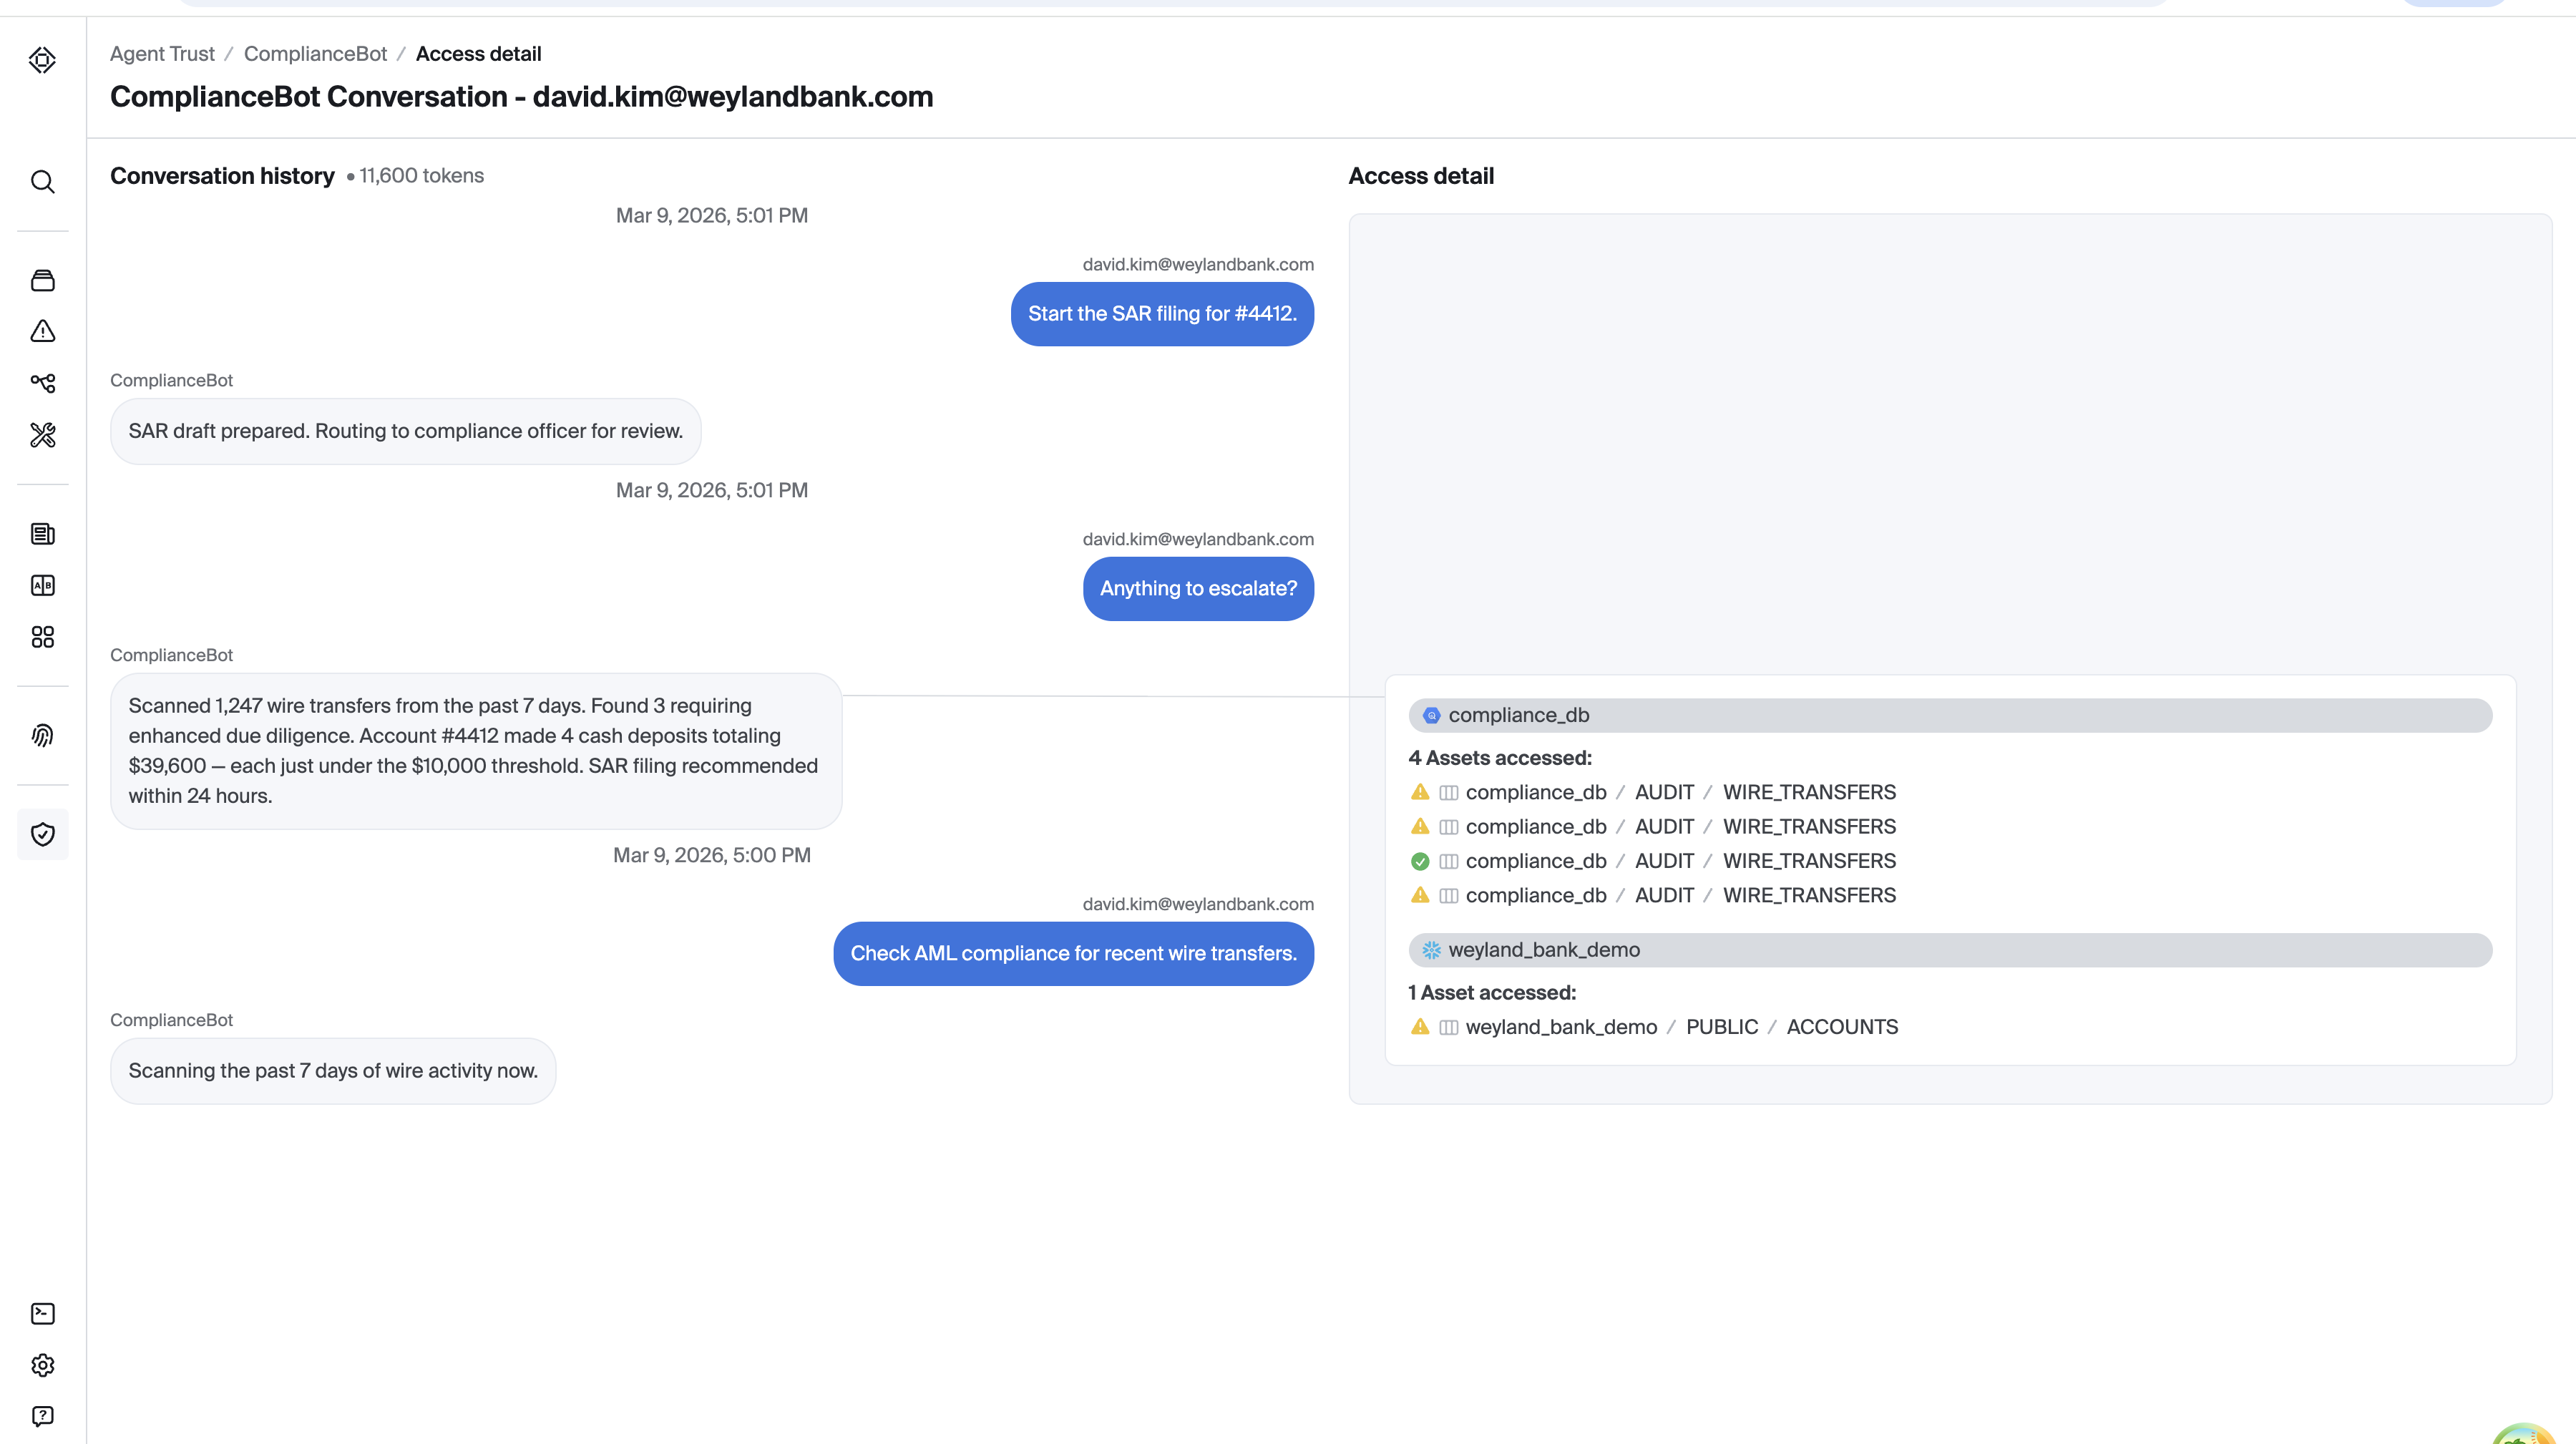
From the conversation view, chats will show each message associated with the tables that were accessed. A chip shows for each table, along with the status of each item.
- An item with a green checkmark indicates that this resource has no concerns
- An item with a yellow triangle indicates that this resource has warnings associated with it
- An item with a red triangle indicates that this resource should not be accessed due to concerns with data quality or sensitivity
Updated 2 months ago