

Agent Cost Dashboard
Requires Agent TrustThis page requires that Agent Trust is enabled for your workspace. If you don't see the Agent trust section in your navigation, please reach out to Bigeye for assistance on enabling it.
The Agent Cost Dashboard is visible from your navigation as Dashboard > Agent cost. It shows how much your AI agents are spending, where the spend is coming from, and when it deviates from what's expected.
Summary cards
Four cards at the top of the dashboard summarize spend over the last 7 days, each compared against the prior 7-day period:
- Agent cost – total cost across all agent conversations
- Tokens – total tokens consumed
- Cost per conversation – average cost per conversation
- Open cost anomalies – count of unresolved cost anomalies, with their combined dollar impact
If no conversations in the window have cost data yet, the cost-based cards show "No cost data" instead of a dollar amount.

Cost over time
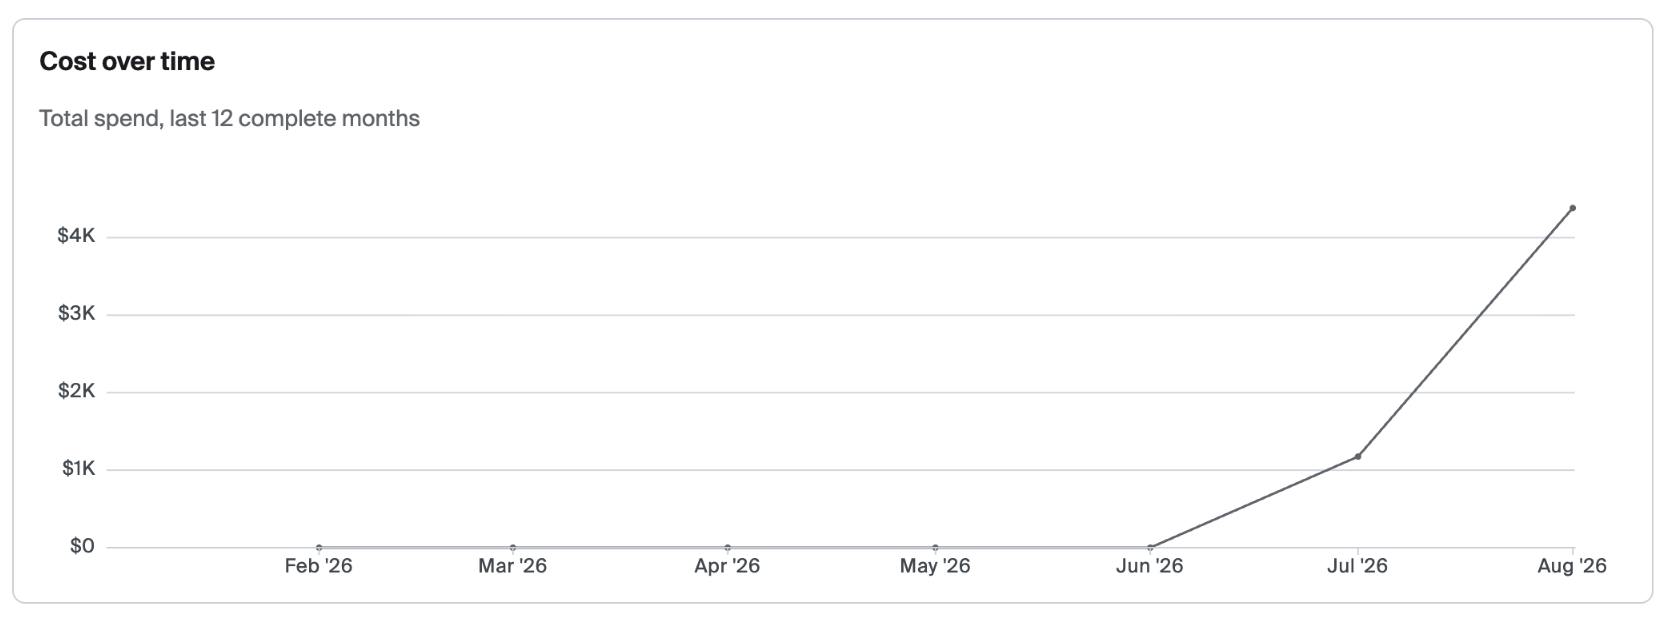
A line chart of total agent spend for the last 12 complete months, plotted month by month. Hover over a point to see the exact cost for that month.
Cost anomalies
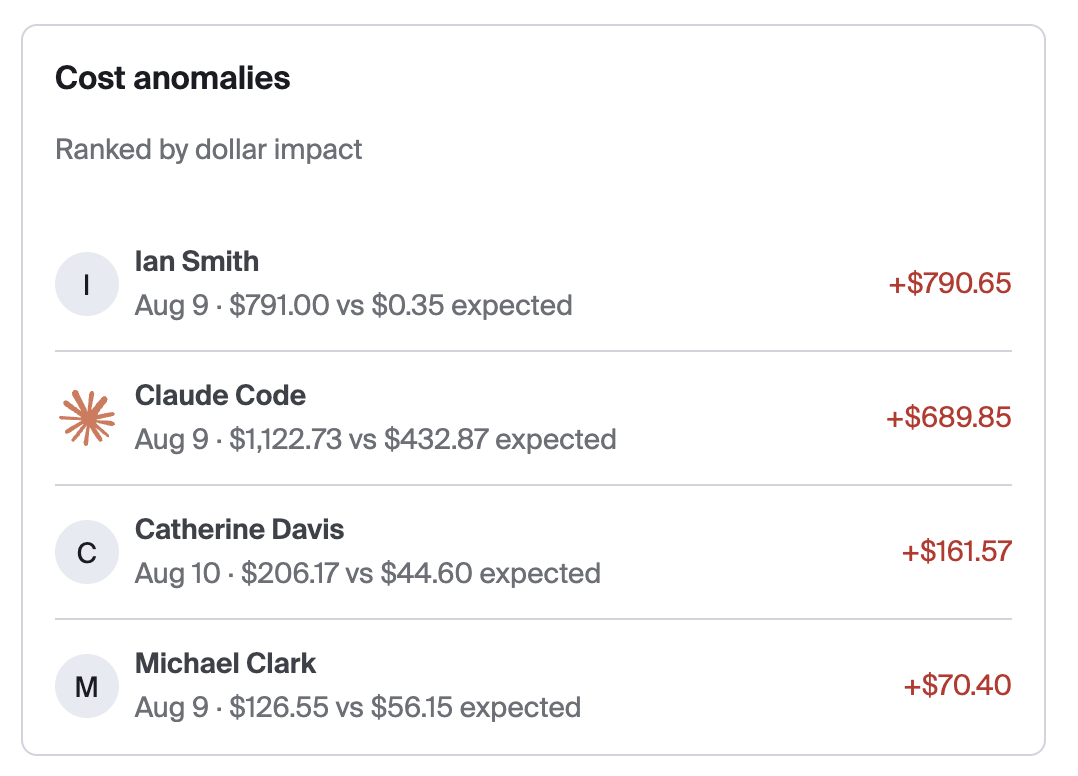
A list of cost anomalies, ranked by dollar impact. Each row shows the agent or user involved, the date of the anomaly, the actual cost compared to the expected cost, and the resulting cost delta — overages are highlighted so you can spot unexpected spend at a glance.
Top spenders
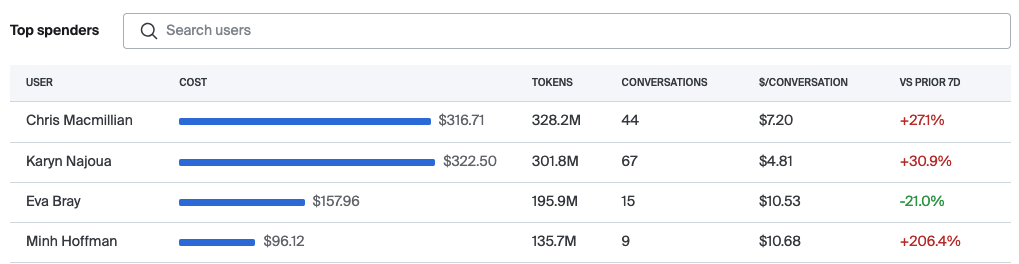
A searchable, paginated table of users ranked by spend over the trailing 7 days. Columns include:
- User
- Cost
- Tokens
- Conversations
- $/Conversation
- Vs prior 7d – change compared to the previous 7-day period
Use the search bar to find a specific user, or page through the full list to see everyone's usage.
Updated 2 months ago